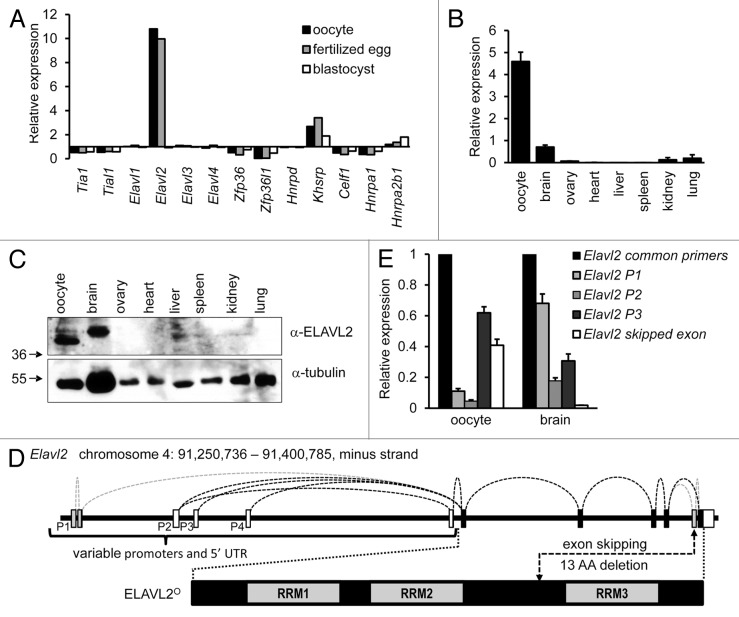
Figure 1. Characterization of Elavl2 expression in oocytes and somatic tissues. (A) Elavl2 transcript level is enriched in oocytes and fertilized eggs relative to somatic tissues. A graph shows an expression ratio of 13 different AUBPs in oocytes, fertilized eggs, blastocysts, and median expression values in somatic tissues calculated from the BioGPS GNF1M.gcrma data set42 providing normalized gene expression data for a comprehensive set of tissues and cell types. (B) RT-PCR analysis of Elavl2 mRNA expression in several tissues using Elavl2 common primers detecting all known Elavl2 splicing variants. Data represent the mean Elavl2 expression ± s.e.m. relative to Hprt1 (n = 2). (C) ELAVL2 expression in different tissues. Twenty micrograms of protein lysates from different tissues and 200 oocytes were loaded per a lane and the blot was probed with ELAVL2 antibody. Tubulin was used as a loading control. The fastest migrating ELAVL2 isoform, which is the most abundant in oocytes, was denoted ELAVL2°. (D) A scheme of the mouse oocyte-enriched ELAVL2 isoform (ELAVL2°) and key differences in alternative Elavl2 splicing variants. Mouse Elavl2 gene is located on chromosome 4 (RRM, RNA binding domain; P1–P4, promoter 1–4; UTR, untranslated region; AA, amino acid). (E) RT-PCR analysis of Elavl2 splicing variants expression in the mouse brain and oocytes. Data represent the mean ± s.e.m. normalized to Hprt1 (n = 3). A signal from Elavl2 common primers was set to one. Elavl2 P1, P2, or P3 primer pairs detect Elavl2 transcripts starting from the promoter 1, 2, or 3, respectively, with or without second-to-last exon deletion. Elavl2 skipped exon primers stands for the Elavl2 splicing variants missing second-to-last exon here denoted Elavl2°. (n, independent experiment performed in triplicates)

An official website of the United States government
Here's how you know
Official websites use .gov
A
.gov website belongs to an official
government organization in the United States.
Secure .gov websites use HTTPS
A lock (
) or https:// means you've safely
connected to the .gov website. Share sensitive
information only on official, secure websites.
