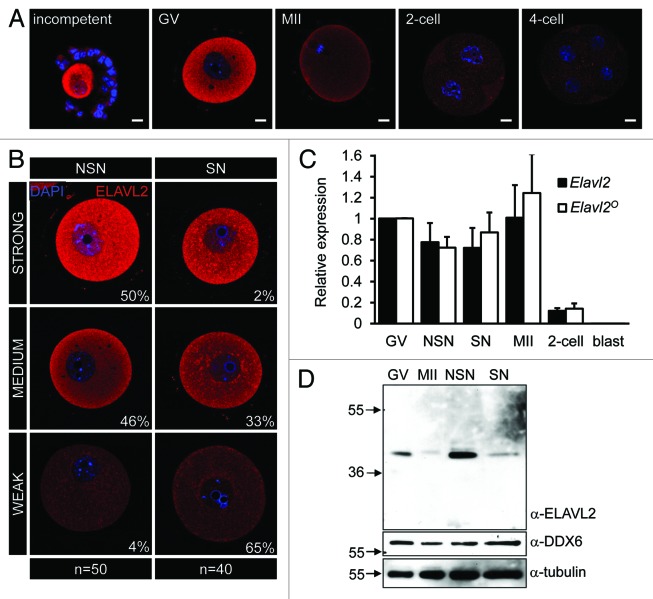
Figure 2. Unique ELAVL2 expression in oocytes. (A) ELAVL2 expression in oocytes and early embryos. Confocal images of incompetent, fully grown GV and MII oocytes, 2-cell and 4-cell embryos after staining with ELAVL2 antibody (red color). DNA staining (DAPI) is shown in blue. The ELAVL2 signal decreases in MII oocyte stage. Scale bar = 10 μm. (B) Confocal images of ELAVL2 expression in fully grown oocytes at non-surrounded and surrounded nucleolus (NSN and SN) stages. Signal intensity was defined using rank-sorted densitometric analysis of 50 NSN and 40 SN oocytes by ImageJ software. While SNS oocytes typically have strong-to-medium ELAVL2 signal intensity, SN oocytes show weak-to-medium intensity suggesting that ELAVL2 is destabilized during the NSN/SN transition. DNA staining (DAPI) is shown in blue. Scale bar = 10 μm. (C) Expression profile of all (Elavl2) and oocyte-specific (Elavl2°) transcript variants in GV, NSN, SN, and MII oocytes, 2-cell embryos and blastocysts (blast). Data were normalized to Hprt1 and represent the mean ± s.e.m from 3 independent RT-PCR experiments. The average Elavl2 and Elavl2° expression were set one in GV oocytes. (D) ELAVL2 downregulation during the NSN/SN transition. One hundred and fifty oocytes from GV, MII, NSN, and SN stages were loaded per a lane. Western blot was probed with ELAVL2 antibody and loading control antibodies (α-tubulin and α-DDX6).

An official website of the United States government
Here's how you know
Official websites use .gov
A
.gov website belongs to an official
government organization in the United States.
Secure .gov websites use HTTPS
A lock (
) or https:// means you've safely
connected to the .gov website. Share sensitive
information only on official, secure websites.
