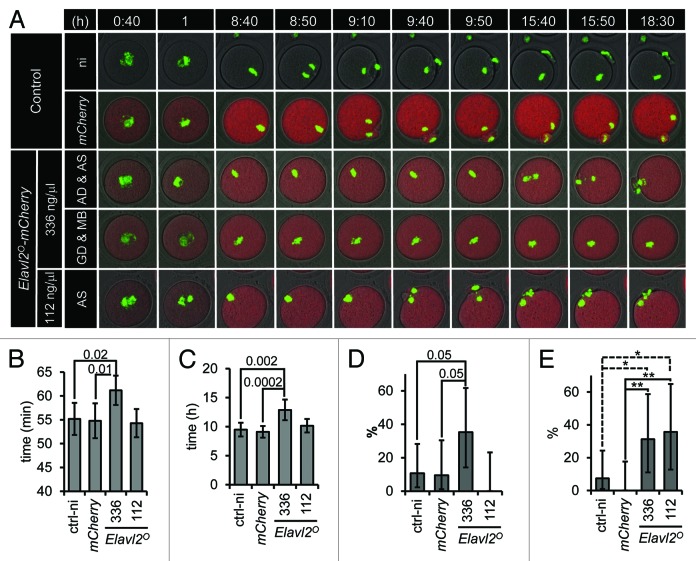
Figure 4. ELAVL2° overexpression affects meiotic maturation. (A) Representative time-lapse images of maturing oocytes. Oocytes from H2B-GFP (CD1 strain) mice were used to visualize chromatin (green color). Non-injected (ni) or injected oocytes with mCherry or Elavl2°-mCherry mRNAs were let to mature and confocal images (starting 40 min after milrinone removal) were acquired every 10 min for 18 h. Two Elavl2°-mCherry mRNAs concentration were used: high, 336 ng/μl (336); low, 112 ng/μl (112). First 2 image sequences show controls, the third and fourth ones depict anaphase delay (AD) with abnormal chromosomal segregation (AS) and germinal vesicle brakedown delay (GD) together with metaphase I block (MB) when high concentration of Elavl2° was used, respectively. The last line shows abnormal chromosomal segregation (AS) without anaphase delay when low amount of Elavl2° was injected. All image sequences represent maximum projection of H2B-GFP channel, single confocal sections of Elavl2°-mCherry and bright field channels. Totally 27 control non-injected, 23 control mCherry, 17 Elavl2°-mCherry (336 ng/ul), and 14 Elavl2°-mCherry (112 ng/ul) oocytes were imaged and analyzed, respectively. (B) Elavl2°-mCherry-injected in high concentration (336) into oocytes caused slightly but significantly delayed GVBD (mean value ± 95% confidence interval (ci), P = 0.01, t test). (C) Anaphase I (defined as the time between the GVBD and the first visible sign of chromosome segregation) is delayed in oocytes with a high but not a low level of Elavl2°-mCherry mRNA (mean values ± 95% ci, P = 0.0002, t test). (D) In contrast to 10% of mCherry-injected oocytes, 35% of Elavl2°-mCherry-injected oocytes stopped development at metaphase I (mean value ± 95% asymmetric ci, P = 0.05, Chi-Square). (E) Approximately 31 and 35% of high and low Elavl2°-mCherry-injected oocytes respectively exhibit problems with chromosome segregation (high: mean value ± 95% asymmetric ci, P = 0.008, Chi-Square; low: mean value ± 95% asymmetric ci, P = 0.005, Chi-Square).

An official website of the United States government
Here's how you know
Official websites use .gov
A
.gov website belongs to an official
government organization in the United States.
Secure .gov websites use HTTPS
A lock (
) or https:// means you've safely
connected to the .gov website. Share sensitive
information only on official, secure websites.
