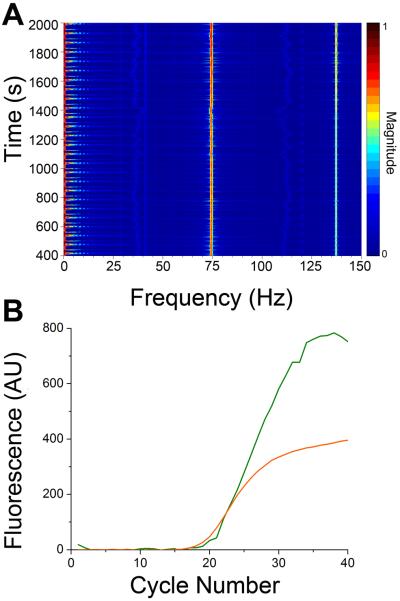
Figure 6. Multiplexed TaqMan probe amplification.
A. A spectrogram detailing all frequencies detected as a function of time during amplification of ACTB and RN18S1. The frequencies of signals from the ACTB and RN18S1 probes, 73 Hz and 137 Hz respectively, increase in magnitude as the amplification progresses. B. The fluorescence of the FAM (green) and TAMRA (yellow) as a function of cycle number is shown. These signals were obtained by extracting the magnitude of the 73 and 137 Hz frequencies during the annealing stage of each thermal cycle.

