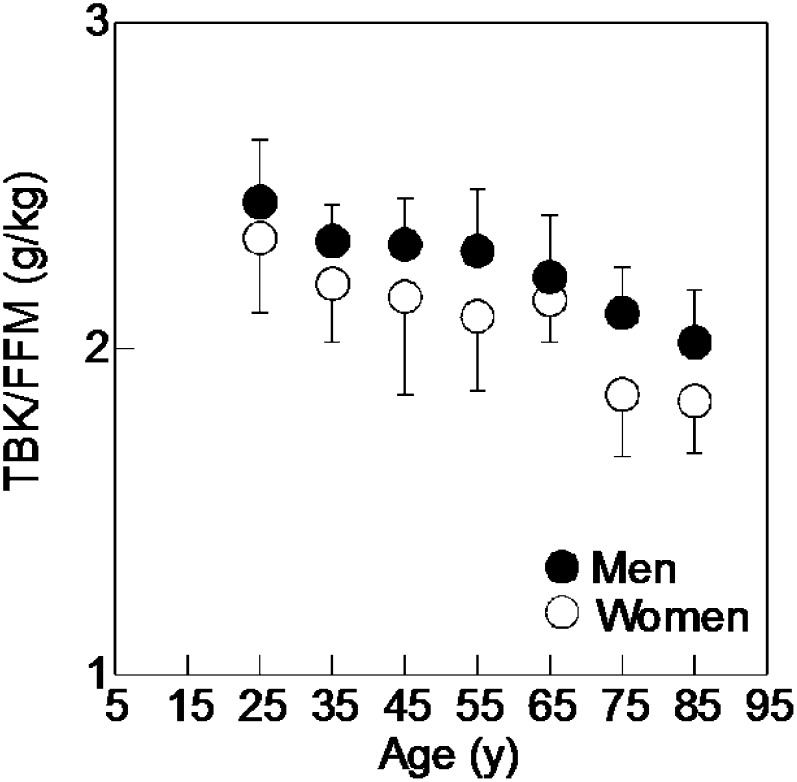
FIGURE 1.
Results from a cross-sectional study with 188 healthy, free-living volunteers from the Boston area aged 20–89 y. Mean values of potassium content of fat-free mass [total body potassium (grams) to fat-free mass (kilograms)] plotted against the age of each group. Fat-free mass was calculated by subtracting body fat derived by neutron inelastic scattering from body weight. Total body potassium was measured in vivo using passive, non-invasive counting of gamma ray emissions from naturally occurring 40K radioisotope. The error bars represent 1 SD for each age group. FFM, fat-free mass; TBK, total body potassium. (Adapted from reference 44 with permission.)

