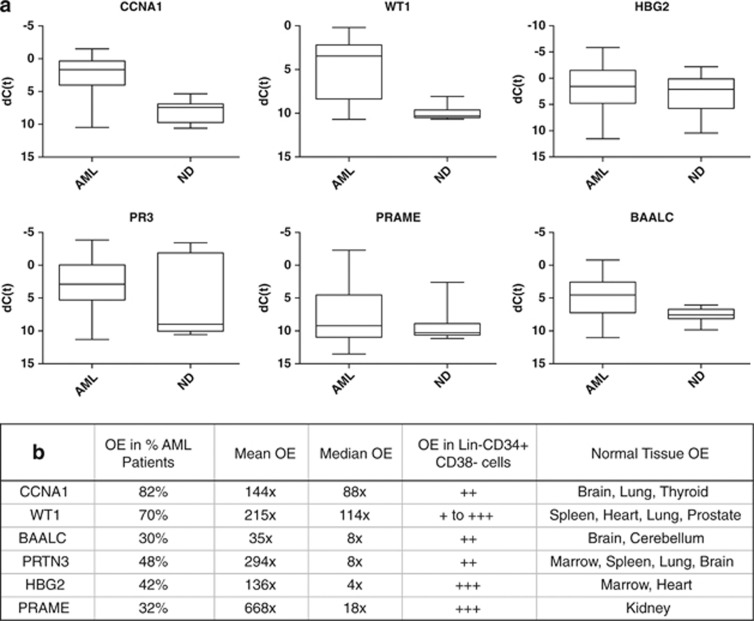
Figure 2.
Top six acute myeloid leukemia-associated antigens. (a) Therapeutic or diagnostic threshold for leading antigen candidates. Expression of antigens in all AML samples compared with all normal donor samples as box-plots where box represents 25th–75th percentile and whiskers represent maximum and minimum dCT values observed. (b) Detailed characteristics of leading AML antigen candidates including what percentage of AML samples tested had at least 5 × OE of that gene, average levels of OE and OE in sorted lineage negative, CD34-positive and CD38-negative cells and normal donor tissues (see Supplementary Information for additional details).

