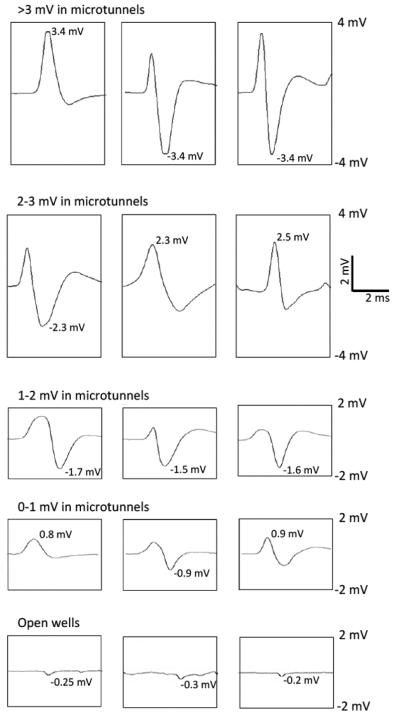
Fig. 3.
Sample waveforms. All the waveforms in rows 1 to 4 were recorded in microtunnels. In each row, each waveform was picked up by a different electrode. The absolute value of the bigger peak of a waveform was measured and considered as the particular waveform’s amplitude. All the waveforms in the same row are in the same amplitude range, >3 mV in the 1st row, 2-3 mV in the 2nd, 1-2 mV in the 3rd and 0-1 mV in the 4th. The 5th row presents sample waveforms recorded in open wells. The scale bar is applied for all the panels.

