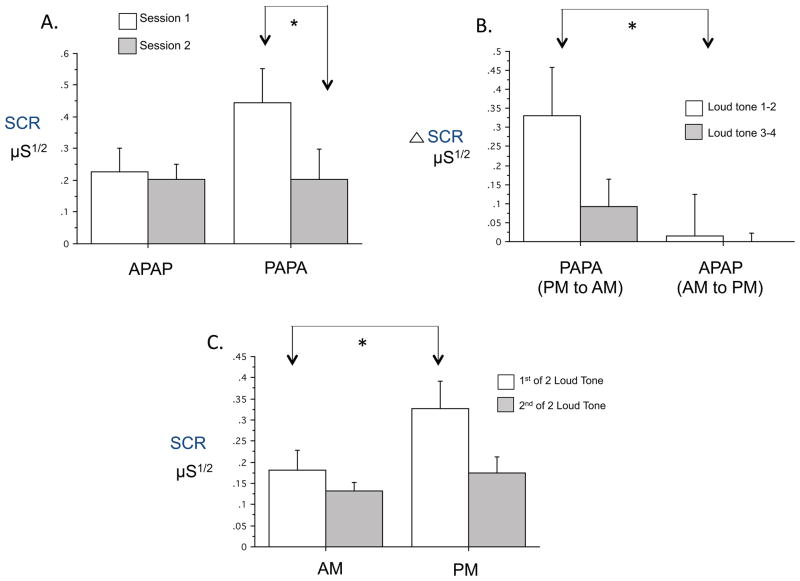
Figure 4.
Comparisons of SCR to loud tones across sessions and between times-of-day. A. First Session-Pair Analyses showing significantly lower SCR Mean Response in the second (AM) vs. first (PM) session of the PAPA group (N=13 APAPA, 15 PAPA). B. Analyses by Session-Order for Change Across Session Pairs across 2 PM to AM sessions in the PAPA group compared to 2 AM to PM changes in the APAPA group. There were significantly greater decreases across both PM to AM sessions combined in the PAPA group than across both AM to PM changes combined in the APAPA group (N=9 APAPA, 10 PAPA). C. Analyses by Time-of-Day collapsing across groups showing significantly greater SCR to the loud tones in the PM compared to AM (N=21). SCR μS1/2: square-root transformed skin conductance response in microSiemens, * p < .05, Error bars depict standard error of the mean.

