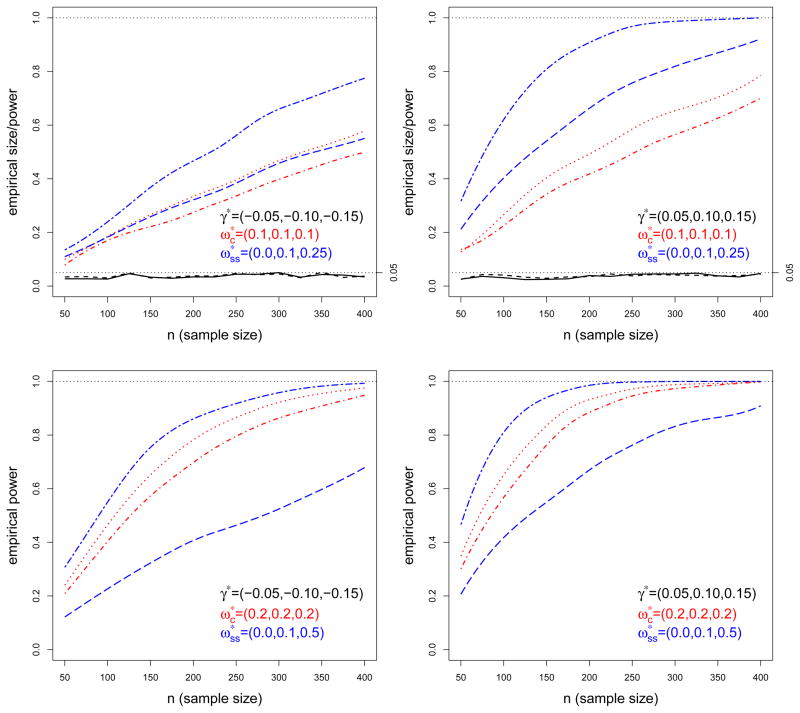
Figure 2.
Empirical size and power of constant mixing weight and stratum-specific mixing weight tests at 5% significance level, homogeneous model is Poisson. The black lines represent the data generated under the null model ( ). The red and blue lines represent the data generated under the constant ( ) and the stratum-specific ( ) mixing weight model, respectively:
True mixing weight is zero (size): ——— stratum-specific mixing weight test; – – – constant mixing weight test
True mixing weight is constant (power):
 stratum-specific mixing weight test;
 constant mixing weight test
True mixing weight is stratum-specific (power):
 stratum-specific mixing weight test;
 constant mixing weight test.

