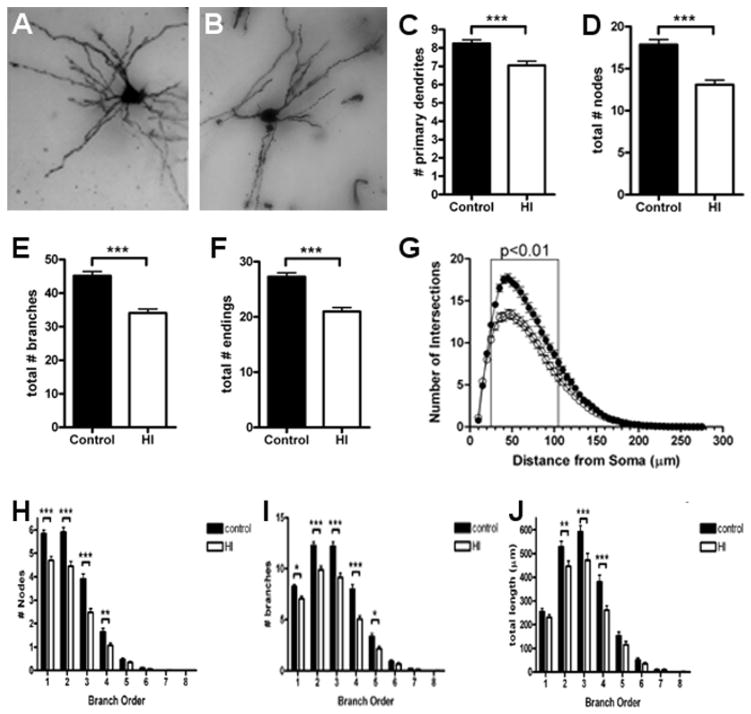
Figure 7.
Abnormal development of the dendritic arbor was seen in MSNs in the CN at 4 weeks after HI. (A) An example of Golgi-stained MSNs is shown for the control (A) and HI groups (B). (C to F) Total number of primary dendritic branches (C), total number of nodes (D), total number of branches (E), and total dendritic endings (F) in the control (black bars) and HI (white bars) groups. (G) Sholl analysis of the number of basal dendritic intersections in control (closed circles) and HI (open circles) groups. (H to J) Branch order analysis of the total number of dendritic nodes (H), total number of dendritic branches (I), total dendritic length (J) in control (black bars) and HI (white bars) groups. n = 121 control and n= 124 HI group cells. Data are means ± SEM. *P < 0.05, **P < 0.01, ***P < 0.001.

