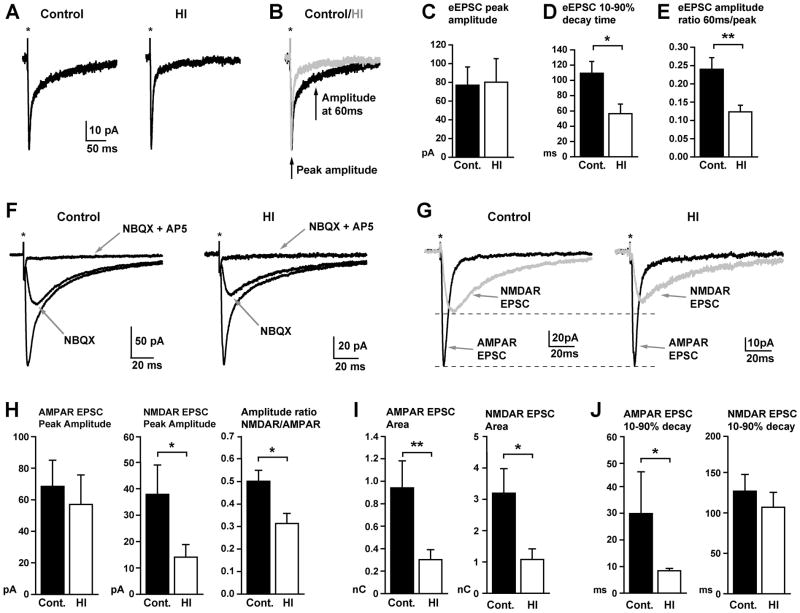
Figure 9.
HI reduces the magnitude, time course and relative receptor makeup of glutamatergic excitatory synaptic currents in caudate nucleus neurons. (A) Representative electrically evoked excitatory postsynaptic currents (eEPSCs) in voltage-clamped (Vh = −30mV) caudate nuclear neurons from control (left) and HI animals (right). Note, to isolate excitatory currents, all recordings were made in the continued presence of the GABAA receptor antagonist, GABAzine (10μM). (B) Traces from (A) are overlaid in (B) to illustrate faster decay time of eEPSCs in HI cells (gray trace) relative to similar amplitude eEPSCs in control cells (black trace). (C–E) Plots of the mean peak amplitude (C), 10–90% decay time (D), and ratio of amplitudes at late (60ms) and early (peak) time points (E) of eEPSCs in control (black) and HI (white) cells. The peak amplitude of eEPSCs was not significantly different (p=0.84), but the 10–90% decay time was significantly reduced in HI cells (p=0.03), resulting in a significantly reduced amplitude ratio when comparing the amplitude at 60ms and at the peak (p=0.004, n = 9 control and 12 HI cells from 3 animals each). (F) Traces show representative eEPSCs in control (left) and HI (right) neurons, and response to bath application of the AMPA/Kainate receptor antagonist, NBQX (25μM) alone, and then combined with the NMDA receptor antagonist, AP5 (50μM), both indicated by gray arrows. (G) Digital subtraction of traces from (F) reveal the AMPA receptor (black) and NMDA receptor (gray) components of the eEPSC in control (left) and HI (right) neurons. Dashed lines illustrate that when the eEPSCs are scaled to the peak of the AMPA receptor component, the amplitude of the corresponding NMDA receptor component is smaller in HI neurons. (H) Plots of the peak amplitude of the AMPA (left) and NMDA (middle) receptor components, and the corresponding amplitude ratio (right, calculated for the two components in each individual cell) of the eEPSC in control (black) and HI (white) neurons. There were no differences in the amplitude of the AMPA receptor component (p=0.34), but a significantly reduced NMDA receptor component (p=0.04), and correspondingly, the ratio of the NMDA to AMPA component amplitudes (p=0.02) in HI neurons. (I) Plots showing that the area of both the AMPA and the NMDA receptor components of the eEPSC are significantly reduced in HI neurons (p=0.008 and 0.01, respectively). (J) Plots showing that the 10–90% decay time of the AMPA receptor component is significantly faster in HI neurons (p=0.03), but the decay time of the NMDA receptor component is not significantly different between control and HI cells (p= 0.48). All plots in H to I are from analysis of pharmacologically isolated AMPA and NMDA receptor components of the eEPSC (as shown in F&G) from 8 control and 12 HI cells from 3 animals each. Statistical comparisons were made with a Student’s t-test (E, H middle and right plots, I, J right plot) or a Mann Whitney Rank Sum test (C, D, H left plot, J left plot), depending on whether the values were normally distributed.

