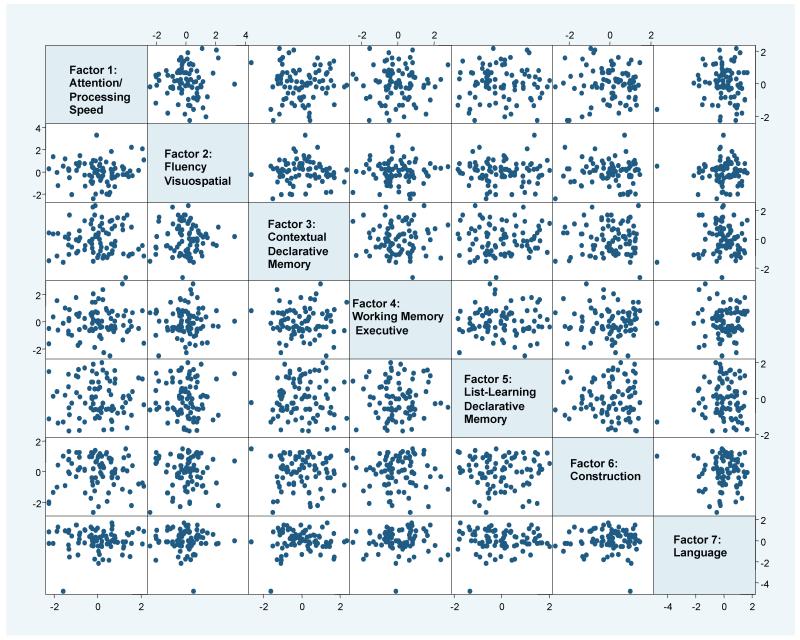
Figure 3. Pairsplot of 7 factors based on PCFA of 17 psychometric scoresa in the PANUC cohort.
A matrix of all possible two-dimensional scatterplots for the seven factor scores obtained from PCFA. Each data point represents an individual subject’s pair of factor scores (based on the horizontal and vertical axes). Given all possible configurations of pairwise factor scatterplots, there is a lack of any distinct clustering of subjects.
aPCFA was implemented on the standardized residuals from the linear regression of the raw scores adjusted for age at visit, education, disease duration, and gender

