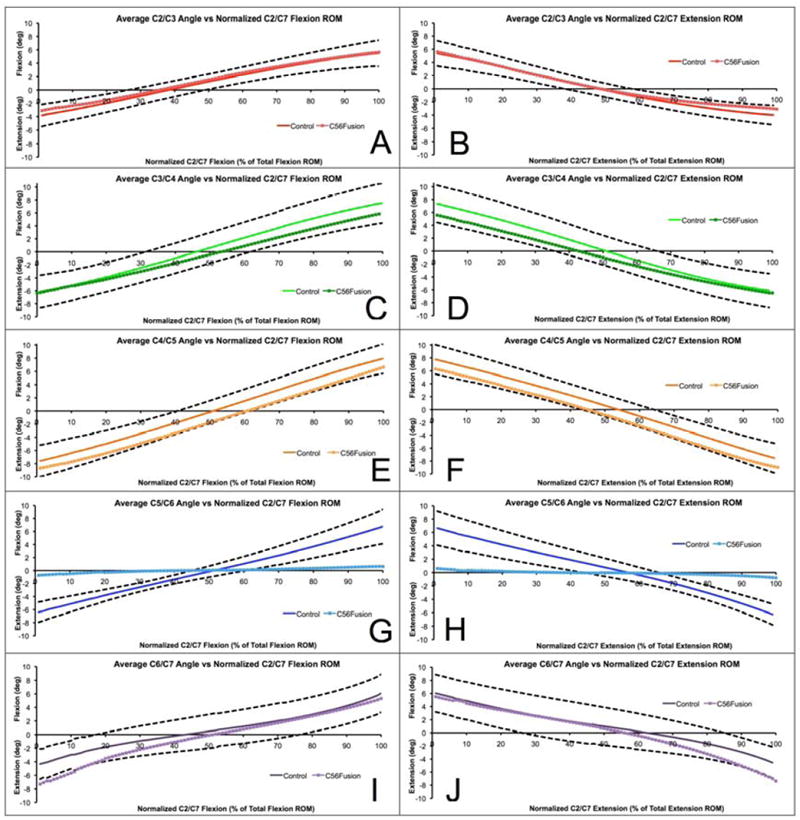
Figure 3.

Average intervertebral flexion-extension curves for each cervical motion segment from C2/C3 (top) to C6/C7 (bottom) for the control group (solid lines) and fusion group (square markers) from full extension to full flexion (left column) and from full flexion to full extension (right column). Vertical axis represents flexion-extension angle at each individual motion segment, normalized to the neutral position. Horizontal axis represents percent of C2/C7 total ROM in flexion (left column) and extension (right column). Dashed black lines denote plus/minus one standard deviation in control group curves. Third-order polynomials fit to each segmental flexion-extension curve for the control group are provided in Table A3.
