
Fig 1.
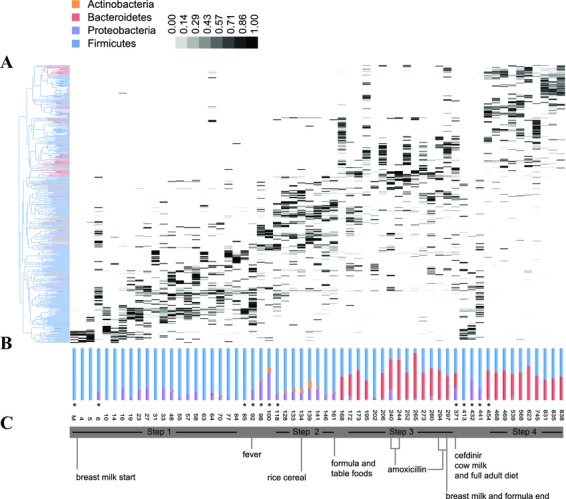
Relative changes in community structure and composition of the intestinal microbiota in early life. (A) Vertical lanes correspond to sample days, and gray-shaded boxes represent the relative abundance of different taxonomic groups. (B) Relative abundances of major bacterial phyla represented in each sample. (C) Significant events with relevance to the infant's diet that may have influence on microbiota changes. From Koenig JE, et al.54