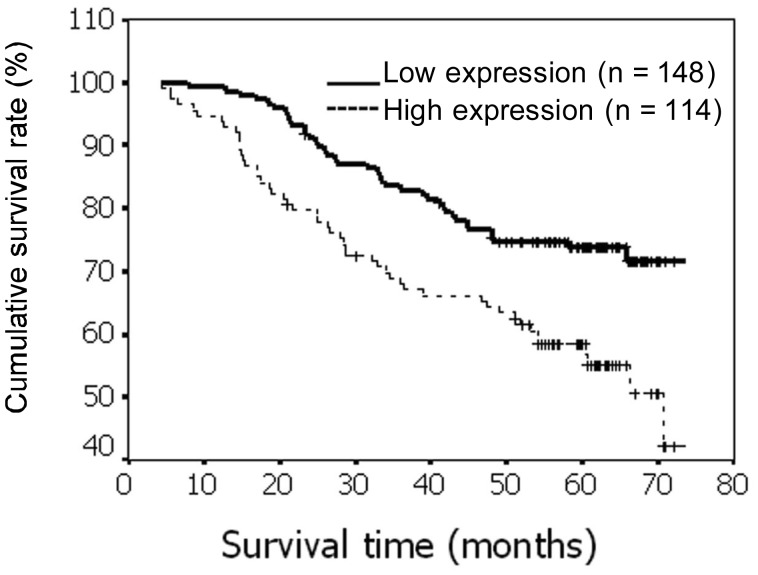
Figure 4. Kaplan-Meier survival curves for breast cancer patients with low CENP-H expression (bold line) versus high CENP-H expression (dotted line).
The difference was compared by the log-rank test. The survival rate was significantly higher in the high expression group than in the low expression group (P = 0.0012).

