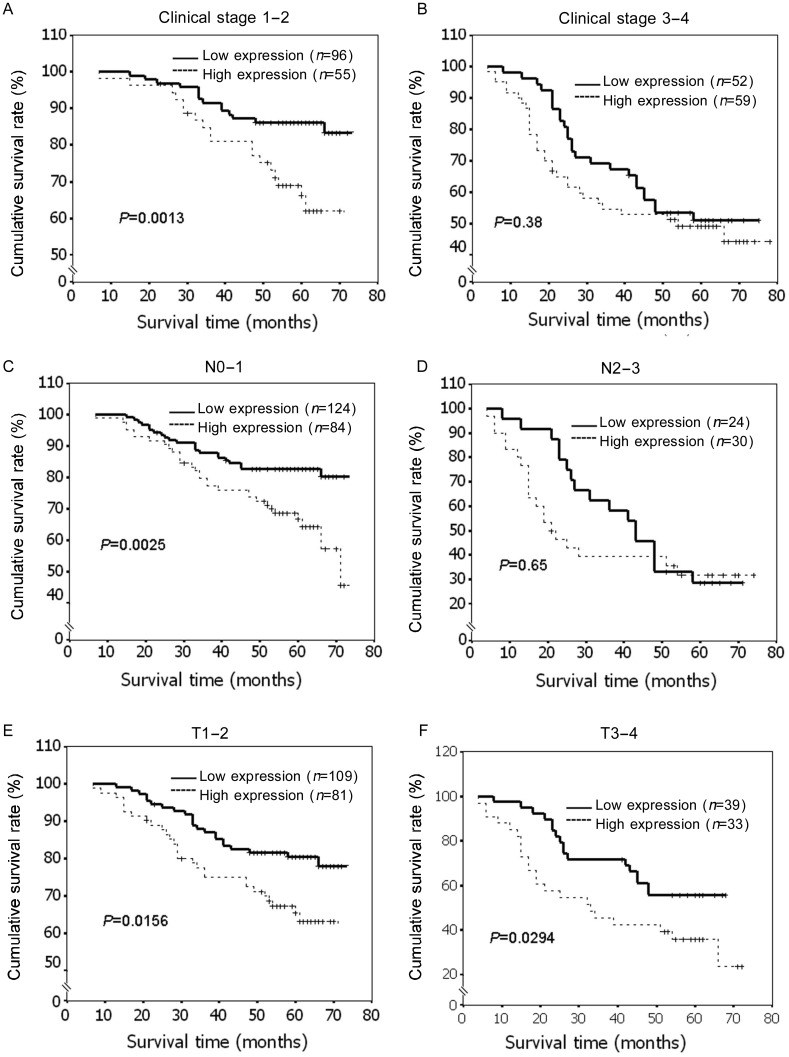
Figure 5. Kaplan-Meier analysis showing the overall survival of patients categorized according to different stages/classifications and status of CENP-H expression.
The curves of patients with high and low expression of CENP-H were compared in the following patient subgroups: stage I–II and stage III–IV (A, B), T classification, N0–N1 and N2–N3 (C, D) and N classification T0–T2 and T3–4 (E, F). In subgroups of stage 1–2, N0–1, T1–2 and T3–4, the survival rates were significantly higher in patients with low CENP-H expression than in those with high CENP-H expression (P < 0.05).

