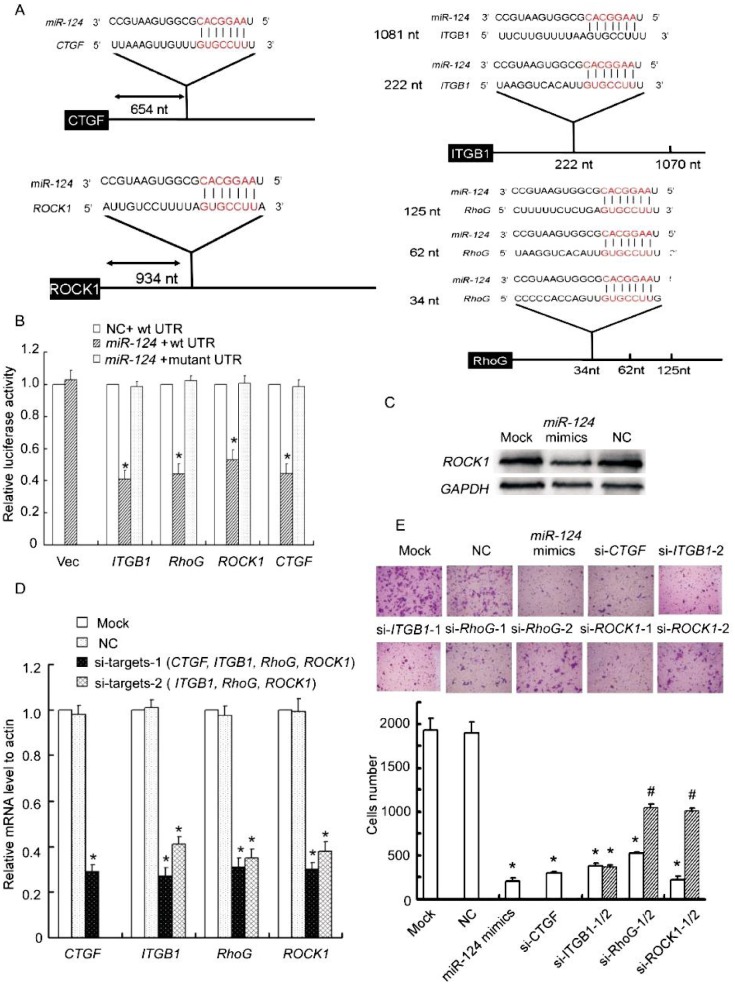
Figure 3. CTGF, RhoG, ITGB1, and ROCK1 are targets of miR-124.
A, schematic illustration of the predicted miR-124–binding sites in the 3′-UTRs of CTGF, RhoG, ITGB1, and ROCK1. B, miR-124 significantly reduces the luciferase activities of CTGF, RhoG, ITGB1, or ROCK1. miR reporter constructs containing wild-type and mutated 3′ -UTRs of the 4 putative target genes were co-transfected with miR-124 mimics or negative control into MDA-MB-231 cells and incubated for 24 h. Relative repression of firefly luciferase expression was standardized to a transfection control. Columns, mean of three independent experiments; bars, SD; *P < 0.01, vs. negative control. C, ectopic expression of miR-124 decreases endogenous levels of ROCK1. MDA-MB-231 cells were transfected with miR-124 mimics, negative control, or mock for 72 h. ROCK1 expression was assessed by Western blotting. D, siRNA transfection potently reduces target mRNA levels. MDA-MB-231 cells were transfected with siRNAs against CTGF, ITGB1, RhoG, ROCK1, negative control, or mock for 48 h. The target mRNA levels were evaluated by realtime quantitative PCR. E, siRNAs against CTGF, ITGB1, RhoG, or ROCK1 reduce the migratory ability of MDA-MB-231 cells. The migration of siRNA-transfected MDA-MB-231 cells was assessed using transwell assays. Columns, mean of three independent experiments; bars, SD. *P < 0.001, # P < 0.01, vs. negative control and mock cells.

