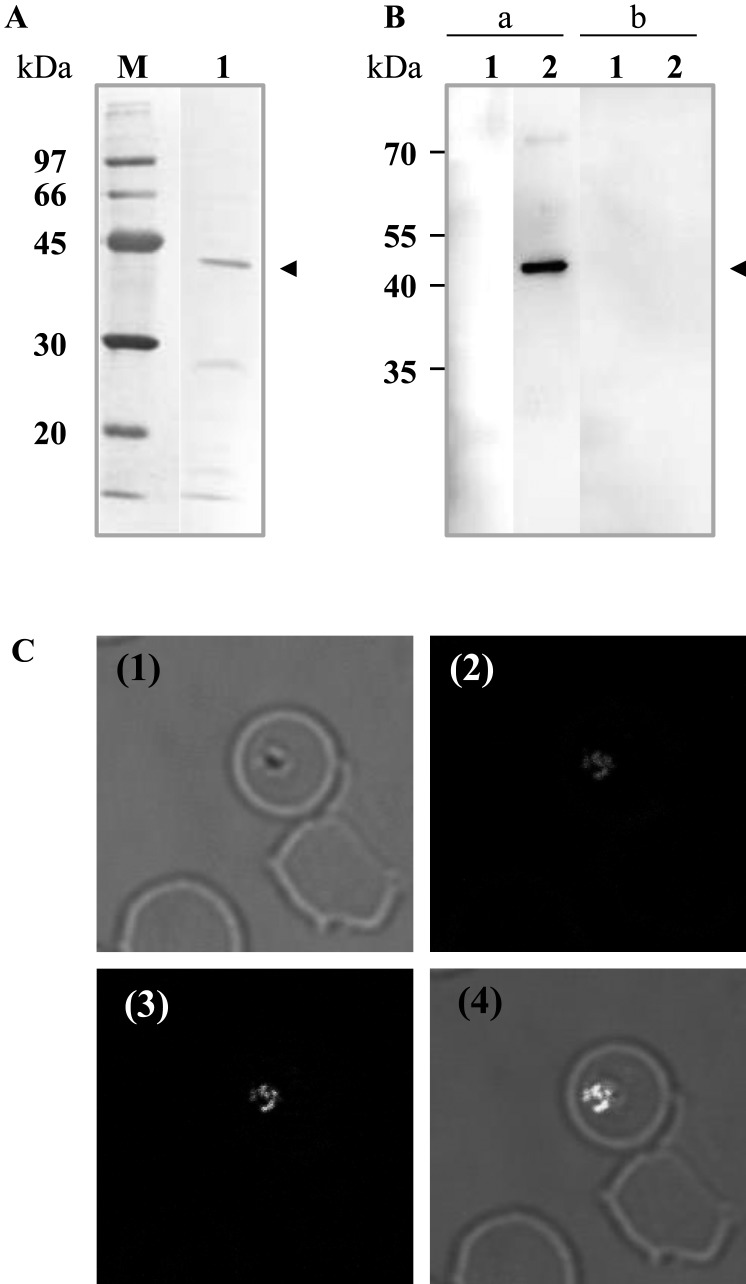
Fig. 3.
Characterization of native BboDHODH. (A) SDS-PAGE showing purified BboDHODH-His stained with amide black. M: Low molecular marker; lane 1: purified rBboDHODH-His. (B) Western blot analysis showing reaction of anti rBboDHODH mice sera with parasite lysates. Lane 1: non infected bovine RBC lysates; lane 2: B. bovis lysates; lane a: anti-rBboDHODH mice sera; lane b: non-immunize mice sera. The arrowhead shows BboDHODH protein. (C) Localization of BboDHODH by IFAT. (1) Phase-contrast; (2) MitoTracker (red); (3) Anti-rBboDHODH (green), (4) The overlaid of fluorescence reactivity.

