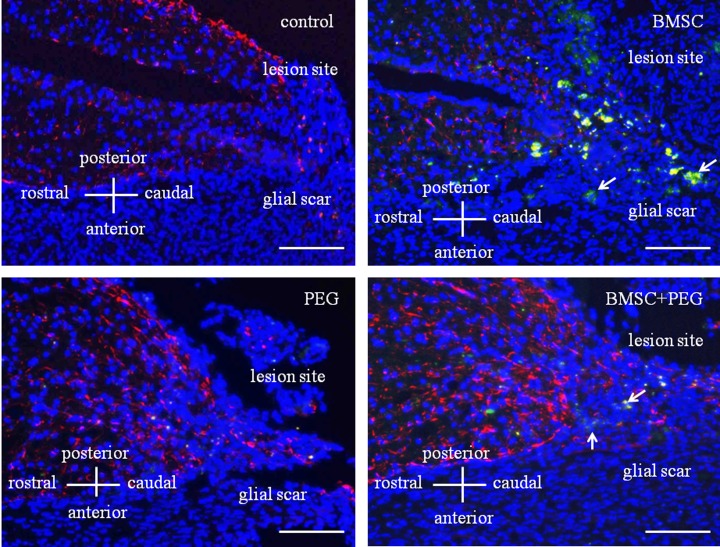
Fig. 1.
Kinetics of transplanted fluorescently labeled cells 2 weeks after surgery. Spinal cord section demonstrated immunofluorescence of GFAP (red) and cell nuclei (blue). Control- and PEG-groups did not show fluorescently labeled cells in the glial scar 2 weeks after surgery. BMSC- and BMSC+PEG-groups showed the transplanted fluorescently labeled cells (arrows) in the glial scar 2 weeks after transplantation. Bar=500 µm.

