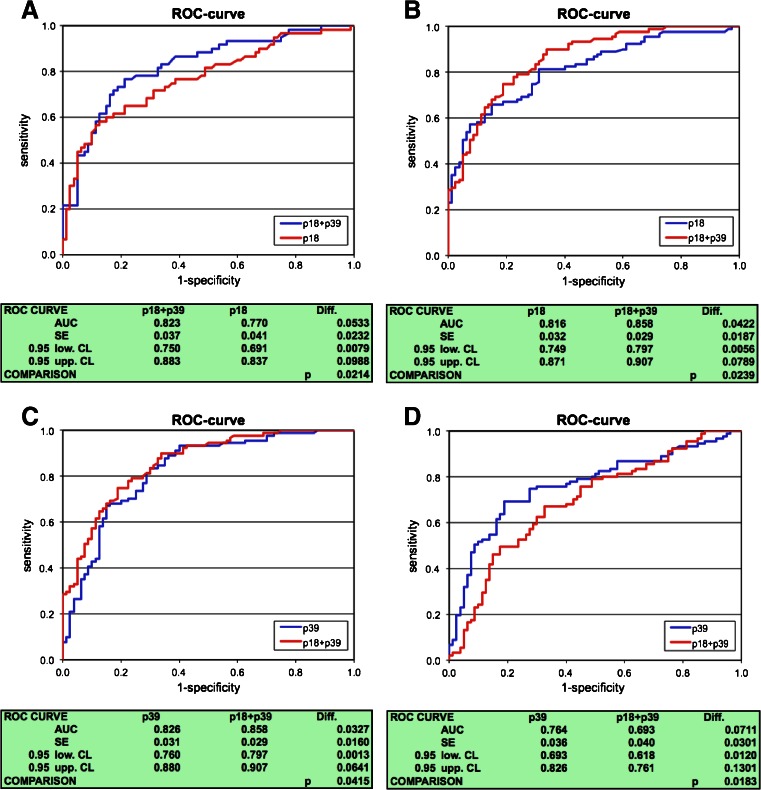
Fig. 1.
Receiver operating characteristic (ROC) curves comparing the antigens/antigen-combinations P18, P39, and P39 + P18 for the detection of anti-Campylobacter antibodies. a Sera of culture-positive acute Campylobacter-enteritis patients tested for anti-Campylobacter IgA. b, c Sera of GBS patients tested for anti-Campylobacter IgA. d GBS patients tested for anti-Campylobacter IgG. AUC area under the curve, SE standard error, 0.95 low./upp. CL 0.95 lower and upper confidence limits, p p-value

