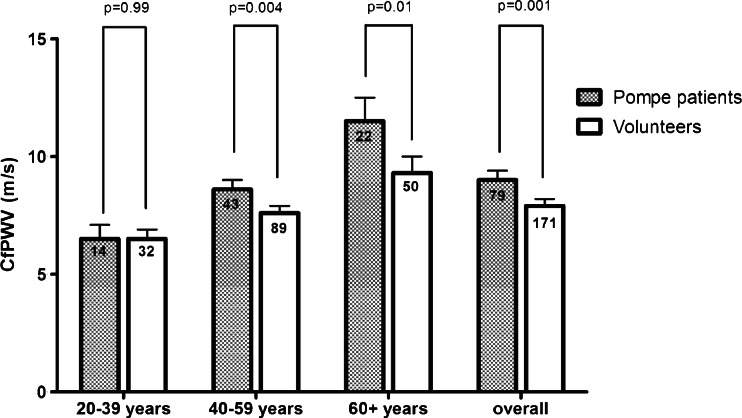
Fig. 1.
Mean values of cfPWV in patients and volunteers per age category. The boxplots represent the mean values and 95 % CI of cfPWV per age category after adjustment for age, gender, mean arterial blood pressure, heart rate and diabetes mellitus. The number of patients and volunteers per age group are given in the bars

