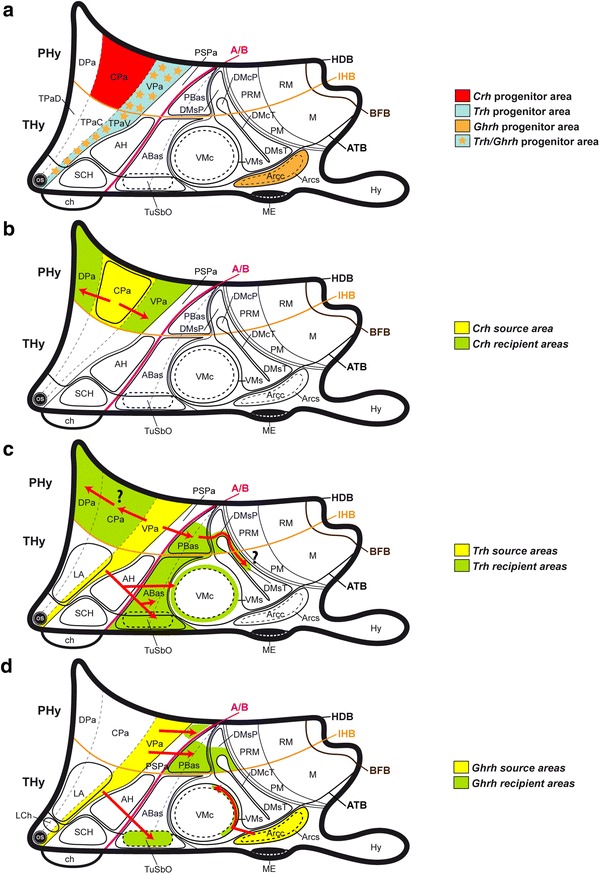
Fig. 13.

Schematic color-coded maps illustrating diverse prenatal progenitor areas and postulated tangential migrations routes within our model (Fig. 1c, d). a Diagram showing the main progenitor areas for cell populations expressing Crh (red), Trh (blue), and Ghrh (orange) during prenatal development of the mouse hypothalamus. b–d Schemata of the described Crh, Trh, and Ghrh source areas (yellow), the apparent recipient areas (green), and the apparent tangential migration routes (red arrows). Uncertain cellular migrations are indicated with a question mark
