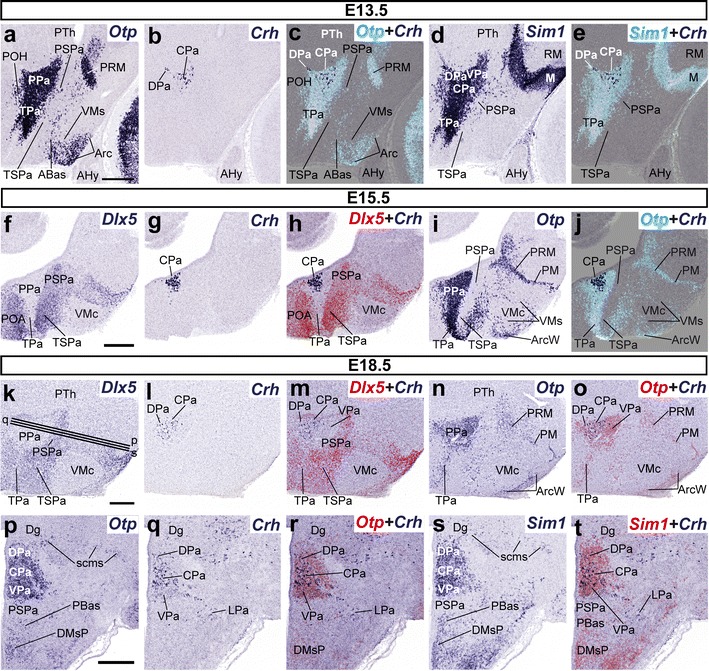
Fig. 2.

Parasagittal (a–o) and transverse (p–t) sections through the hypothalamus of E13.5 (a–e), E15.5 (f–j), and E18.5 (k–t) embryos at different levels, comparing in each case the presence of Crh-positive (Crh+) cells with expression of the indicated reference markers (Otp, Sim1, Dlx5). Corresponding digital overlaps with pseudocolored reference genes and Crh signal are marked with a plus symbol. Transverse section planes (p, q, s) are shown in k. Scale bars 300 μm
