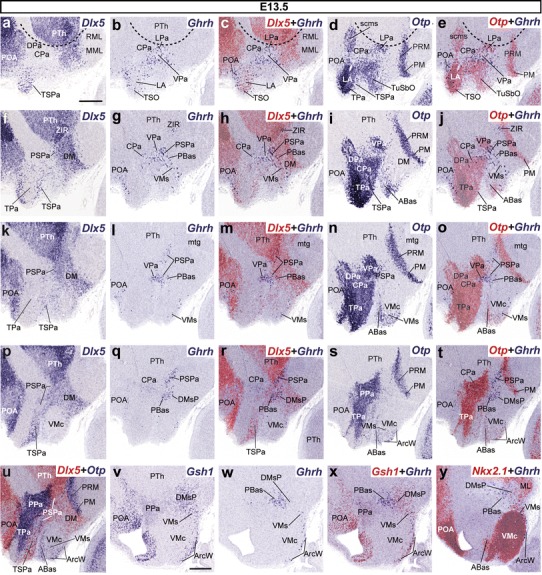
Fig. 9.

Pairs of adjacent parasagittal sections of E13.5 embryos taken at lateral (a–j), intermediate (k–u), and medial (v–y) levels, comparing in each case the expression pattern of the indicated reference genes (Dlx5, Gsh1, Otp, Nkx2.1) with the presence of Ghrh+ cells. Corresponding digital overlaps with pseudocolored reference markers and Ghrh signals are marked with a plus symbol. Dashed lines in a–e represent the hypothalamo-diencephalic boundary. Scale bars 300 μm
