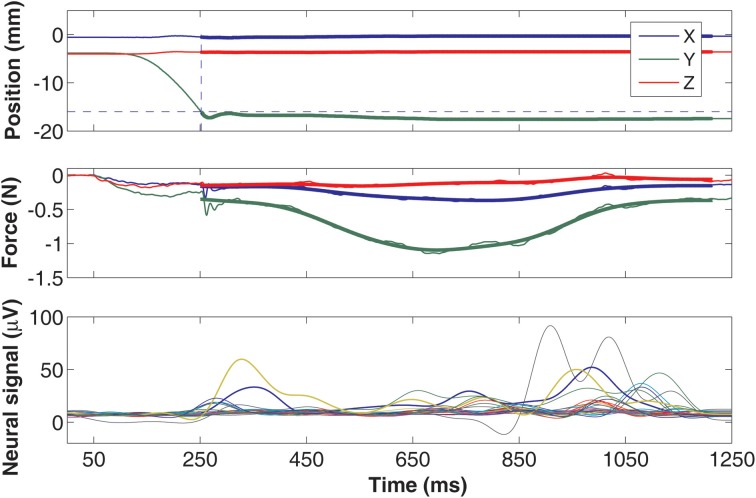
Figure 5.
Plots of position (top) and force traces (middle) from a typical lever press trial (Y in green is vertical, X in blue and Z in red are horizontal components). The position of the lever is moved from its initial position and reaches the target level (dashed horizontal line) at the dashed vertical line. A threshold force value of 0.11 N was used to determine the starting and ending points of the isometric region. The forces from the isometric portion of the trial used in regression analysis are filtered by an 8 Hz low-pass and plotted as thick lines. The bottom plot shows the rectified-filtered version of all the neural channels.

