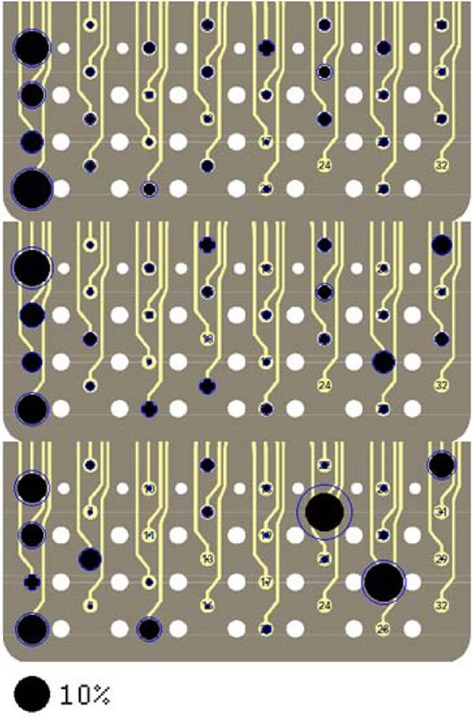
Figure 9.

Signal contributions from individual neural channels superimposed on three images of the electrode array in Rat 1. Each image contains percent contributions for one direction of the forelimb force (X, Y, and Z, top to bottom). The sizes of the filled, black circles indicate average percent contributions across multiple trials in the session and the rings around the circles show the standard deviations. The large black circle on the bottom represents a contribution of 10%. Contacts 24 and 32 were not used.
