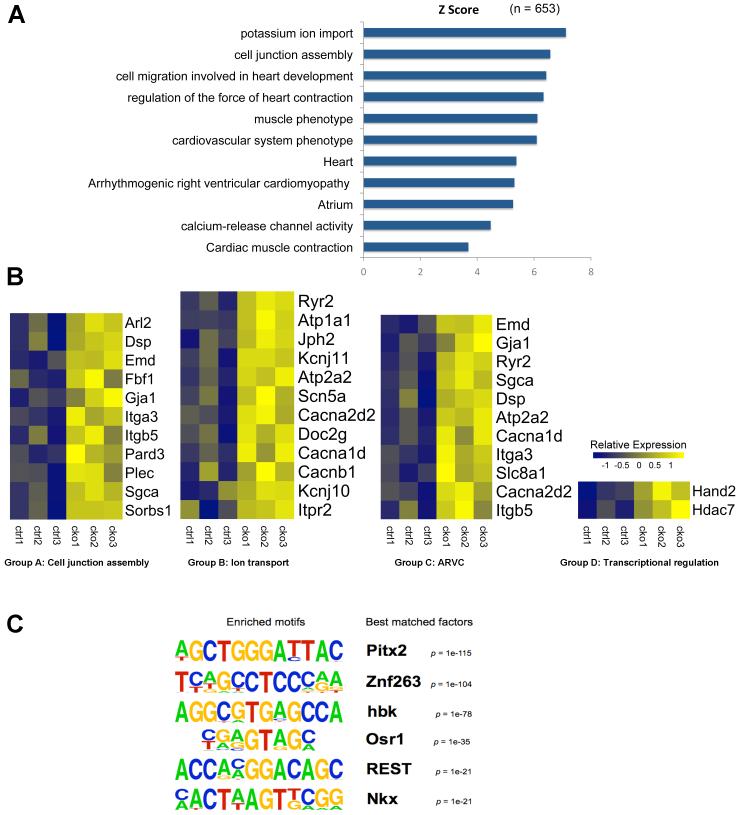
Figure 3.
Overlay of Pitx2 ChIP-Seq and gene expression profiling assays for Pitx2 CKO heart. (A) Gene ontology (GO) analysis for genes (n=653) from overlay of Pitx2 ChIP-Seq and Pitx2 CKO microarray assays (genes in close proximity to Pitx2 binding chromosomal regions identified by Pitx2 ChIP-Seq assay that also show significant change in microarray assay for Pitx2 CKO heart). Both assays performed on 3-month-old adult mouse hearts. (B) Heat map of gene expression profiling obtained by Pitx2 CKO microarray assay. The color bar represents relative expression level of log-transformed value for each gene across different samples. Ctrl1-Ctrl3: control mouse heart (Pitx2 Flox/Flox); CKO1-CKO3: Pitx2 CKO mouse heart (Pitx2 Flox/Flox MCK-Cre). (C) Motif analysis for peaks from Pitx2 ChIP-Seq (n=11,280). Eriched DNA binding motifs and best matched factors are shown.

