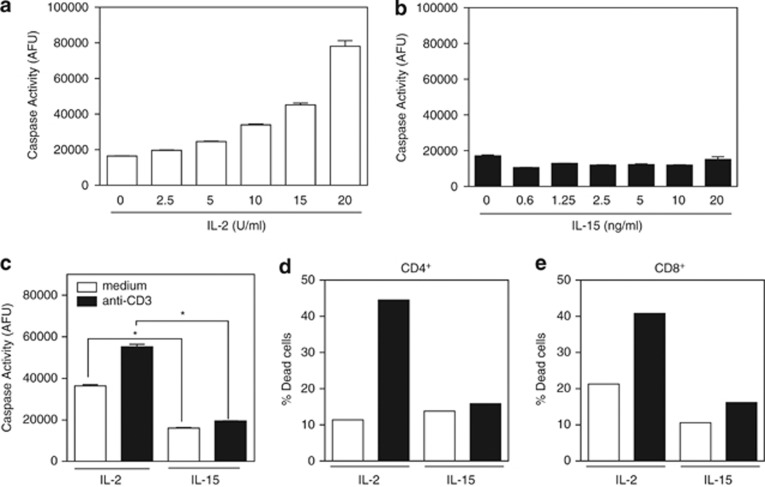
Figure 1.
IL-2 promotes caspase activity and activation-induced cell death compared with IL-15. Lymph node T cells were stimulated with anti-CD3/anti-CD28 for 2 days and then washed on day 3 and recultured in the presence of the indicated doses of IL-2 or IL-15. (a and b) Dose response of caspase activity as measured by DEVD-rhodamine after treatment with increasing amounts of IL-2 or IL-15 for 2 days. Data are representative of three independent experiments. Values are mean±S.E.M. The significance of differences observed in caspase activity within each cytokine group was analyzed by one-way ANOVA followed by Bonferroni multiple comparisons test (overall P-value <0.0001 in a and not significant in b). (c–e) On day 5, T cells recultured in IL-2 (50 U/ml) or IL-15 (20 ng/ml) were either not restimulated (white bars) or anti-CD3 restimulated (black bars) for 4 h, and analyzed for (c) caspase activity by DEVD-rhodamine assay and (d and e) cell death by TUNEL assay. Data are representative of three independent experiments. Values are mean±S.E.M. The significance of differences observed in caspase activity was analyzed by two-way ANOVA followed by Bonferroni multiple comparisons test (*P<0.0001)

