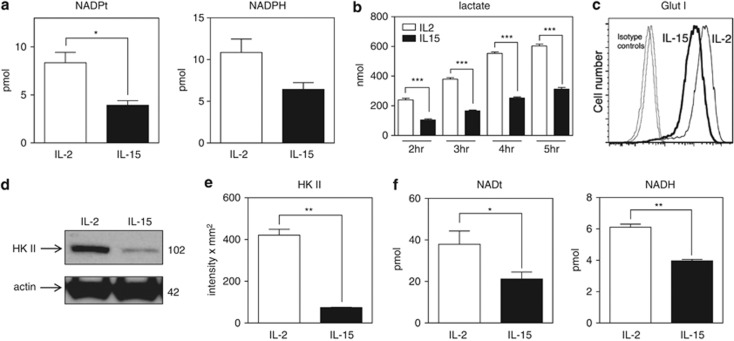
Figure 8.
IL-15 promotes reduced glycolysis, NADPH, and NADH. Day 5 T cells cultured in IL-2 or IL-15 were analyzed for (a) total levels of NADP(H) and NADPH. Data shown are based on the results of three combined independent experiments. Values are mean±S.E.M. Statistical analysis was assessed by Student's t-test (*P<0.05). (b) Production of lactate as an independent measure of glycolysis using supernatants from cultures for the indicated times. Values are mean±S.E.M. The significance of differences observed was analyzed by two-way ANOVA followed by Bonferroni multiple comparisons test (***P<0.0001). (c) Surface glucose transporter 1 (GLUT 1) levels by flow cytometry. (d and e) Immunoblot and densitometry for hexokinase II (HK II). Data are representative of four independent experiments. Values are mean±S.E.M. Statistical analysis was assessed by Student's t-test (**P<0.001). (f) Total levels of NAD(H) and NADH. Data shown are based on the results of three combined independent experiments. Values are mean±S.E.M. Statistical analysis was assessed by Student's t-test (*P<0.05; **P<0.001)

