Figure 5.
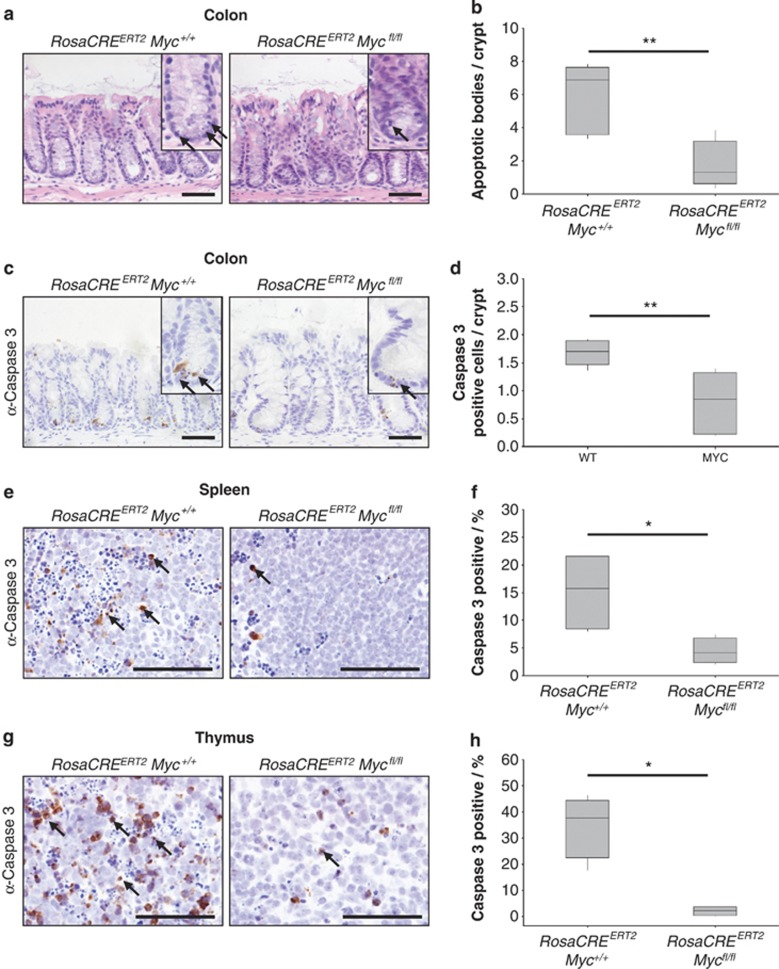
MYC deletion prevents DNA damage-induced apoptosis in multiple tissues. (a) H&E staining of wild type (RosaCreERT2 Myc+/+) and MYC-deficient (RosaCreERT2 Mycfl/fl) colons 6 h following 14 Gy irradiation, arrows show apoptotic bodies. Scale bars=50 μm. (b) Scoring of apoptotic bodies from H&E sections shows a significant decrease in apoptosis in MYC-deficient colons following 14 Gy irradiation compared with wild type (** wt versus Myc, P=0.0059, Mann Whitney n=5 versus 7). (c) Caspase 3 IHC staining of wild type (RosaCreERT2 Myc+/+) and MYC-deficient (RosaCreERT2 Mycfl/fl) colons 6 h following 14 Gy irradiation, arrows indicate Caspase 3-positive cells. Scale bars=50 μm. (d) Scoring of Caspase 3-positive cells (percentage of total cells: n>500) shows a significant decrease in apoptotic cells in MYC-deficient colons (** wt versus Myc, P=0.0059, Mann Whitney n=5versus7). (e) Caspase 3 IHC staining of wild type (RosaCreERT2 Myc+/+) and MYC-deficient (RosaCreERT2 Mycfl/fl) spleens 6 h following 14 Gy irradiation, arrows indicate Caspase 3-positive cells. Scale bars=50 μm. (f) Scoring of Caspase 3-positive cells (percentage of total cells: n>500) shows a significant decrease in apoptotic cells in MYC-deficient spleens (* wt versus Myc, P=0.0152, Mann Whitney n=4). (g) Caspase 3 IHC staining of wild type (RosaCreERT2 Myc+/+) and MYC-deficient (RosaCreERT2 Mycfl/fl) thymus 6 h following 14 Gy irradiation, arrows indicate Caspase 3-positive cells. Scale bars=50 μm. (h) Scoring of Caspase 3-positive cells (percentage of total cells: n>500) shows a significant decrease in apoptotic cells in MYC-deficient thymus (* wt versus Myc, P=0.0152, Mann Whitney n=4)

