Figure 2.
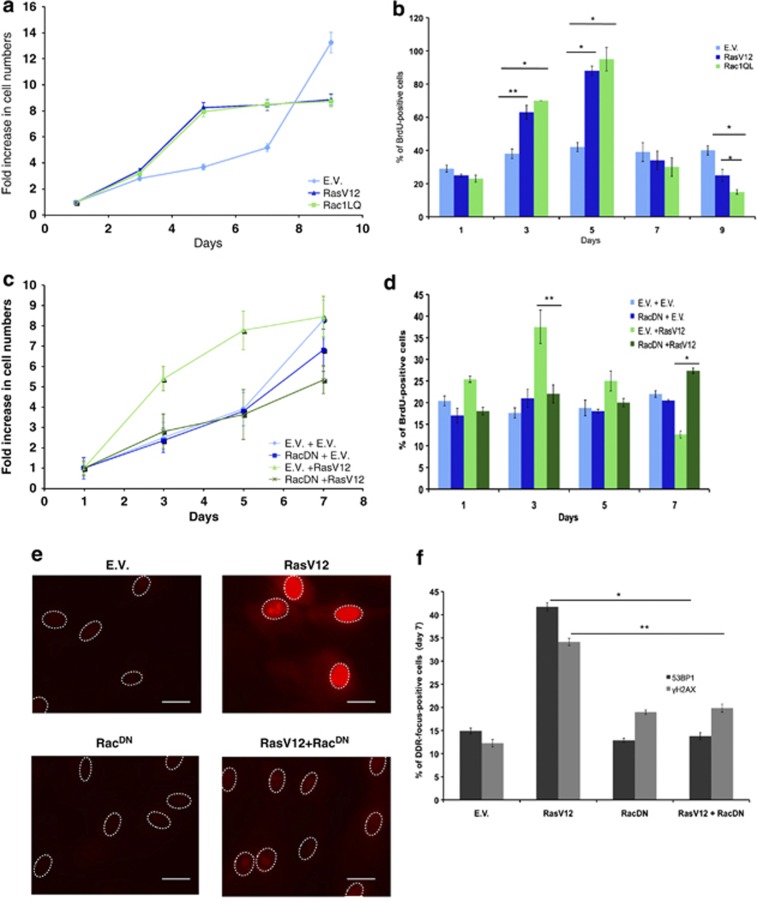
Rac mediates H-RasV12-induced ROS production and their effects. (a) NHFs were transduced with E.V. or H-RasV12- or activated Rac1 (Rac1QL)-expressing retroviruses. The growth curves show that activated Rac1QL induces hyperproliferation and cellular senescence in a manner very similar to RasV12. Proliferation is shown as the ratio of fold increase in cell numbers compared with day 1. (b) BrdU incorporation rates measured at the indicated time points of the growth curve shown in a demonstrate that Rac1QL expression mimics RasV12 expression. BrdU incorporation rates of RasV12- and Rac1-expressing cells are compared at days 3, 5 and 9 with respect to the E.V. Error bars indicate S.E.M. (n≥ 3), and differences are statistically significant (*P-value < 0.01, **P- value <0.05). (c) Expression of a dominant negative form of Rac1 (RacDN) prevents H-RasV12-induced hyperproliferation and OIS establishment. (d) BrdU incorporation rates measured at the indicated time points of the growth curve shown in c demonstrate that expression of RacDN prevents oncogene-induced increased DNA replication rates and replicative arrest associated with OIS. BrdU incorporation rates of RasV12-expressing cells are compared at days 3 and 7 with respect to RasV12-activated co-expressing RacDN cells. Error bars indicate S.E.M. (n≥ 3), and differences are statistically significant (*P-value < 0.01, **P -value<0.05). (e) RacDN expression in RasV12 cells reduces the level of oncogene-induced ROS as detected by DHE. Scale bar: 20 μm. (f) Quantification of oncogene-induced DDR in the form of γH2AX and 53BP1 nuclear foci of cells at the last time point of the growth curves shown in c indicates that DDR is reduced in RasV12-expressing cells upon co-expression of RacDN. The percentages of DDR in the form of γH2AX and 53BP1 foci of cells are compared individually for RasV12-expressing cells between co-expression of E.V. and RacDN. Error bars indicate S.E.M. (n≥ 3), and differences are statistically significant (*P-value < 0.01 for 53BP1 foci; **P-value < 0.05 for γH2AX foci). (See also Supplementary Figure S2)

