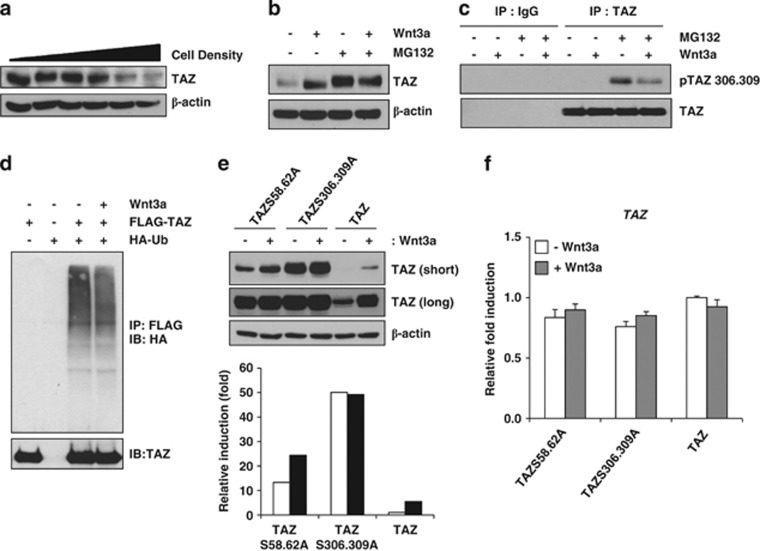
Figure 2.
Wnt3a induces dephosphorylation of TAZ. (a) Increasing amounts of C3H10T1/2 cells (0.1, 0.2, 0.5, 1, 2 and 3 × 10⁶ cells/well) were plated onto six-well plates, and, after 24 h, TAZ expression was analysed by western blot analysis. The expression of β-actin was analysed as a loading control. (b) C3H10T1/2 cells were plated at a high density (3 × 10⁶ cells/each well) and incubated with Wnt3a-conditioned medium for 24 h in the presence or absence of 10 μM MG132. Next, cell lysates were prepared, and TAZ expression was analysed. (c) The cell lysates in (b) were immunoprecipitated with an anti-TAZ antibody (BD Biosciences, cat#560235). TAZ phosphorylated at serine 306 and 309 and unphosphorylated TAZ were analysed by western blot analysis. (d) FLAG-TAZ and HA-Ubiquitin expression plasmids were transfected into 293T cells and incubated with Wnt3a-conditioned medium in the presence of 10 μM MG132 for 12 h. Subsequently, the cell lysates were immunoprecipitated with anti-FLAG agarose beads, and the precipitated proteins were separated on SDS-PAGE and analysed with an anti-HA antibody for detection of ubiquitinated TAZ. Introduced TAZ was analysed by western blot analysis. (e) FLAG-tagged TAZ wild-type, TAZS306,309A, and TAZS58,62A mutants expressing C3H10T1/2 cells were prepared by retrovirus. The stable cell lines were incubated in the presence or absence of Wnt3a. At 24 h after Wnt3a treatment, TAZ expression was analysed by western blot analysis. The expression of β-actin was analysed as a loading control. The bottom panel indicates the expression levels of TAZ analysed by a densitometer. Short and long indicate film exposure time. (f) The mRNAs in (e) were isolated, and TAZ expression was analysed by qRT-PCR

