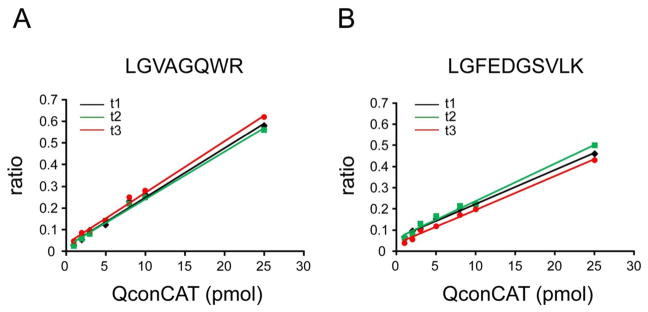
Figure 3.

Response curves for quantification of UCH-L1 in the whole frontal cortex homogenate. The area ratio of a corresponding heavy peptide to light peptide was plotted vs amount of QconCAT added. (A) Three individual transitions (t1–t3) for Q1: (t1) 443.7/546.3 and 450.2/555.3; (t2) 443.7/617.3 and 450.2/627.3; (t3) 443.7/773.4 and 450.2/785.4. (B) Three individual transitions (t1–t3) for Q3: (t1) 532.8/618.3 and 538.3/625.3; (t2) 532.8/747.4 and 538.3/755.4; (t3) 532.8/951.5 and 538.3/961.4.
