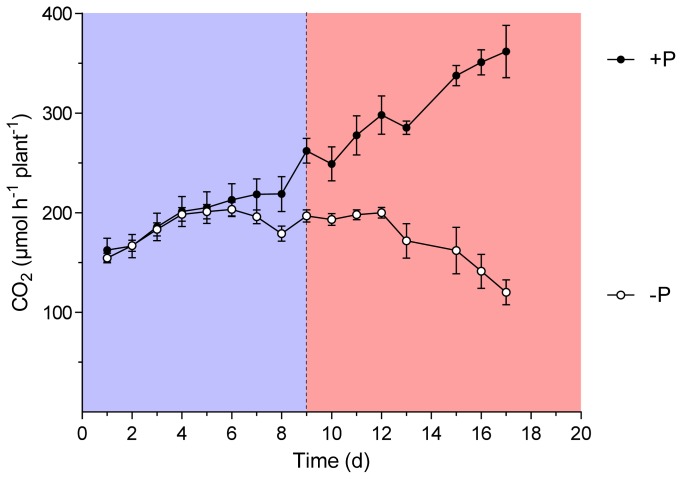
Figure 3.
Root/nodule CO2 release of M. truncatula wild-type plants grown at sufficient P supply (+P) and during P depletion (−P). Data are given as means of six replicates ± SE. Each point represent the amount of CO2 evolved measured at 11 am. The dotted line indicates the point in time when treatments began to differ significantly (t-test, p < 0.05). The colors distinguish the period of significantly different ANA (reddish) from the period of P depletion but not yet different CO2 evolution (blue).

