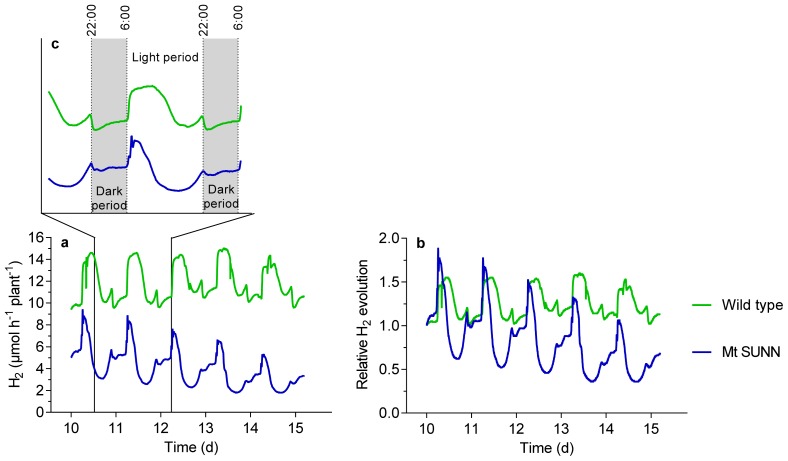
Figure 6.
(a) Apparent nitrogenase activity (ANA), and (b) relative nitrogenase activity of M. truncatula wild-type and sunn plants at day 10 through 15 of the P-depletion treatment. The data in (c) show a period of 36 h with the dark periods indicated by grey color. Data are means of 6 replicates. Data for per plant H2 evolution were taken every five minutes.

