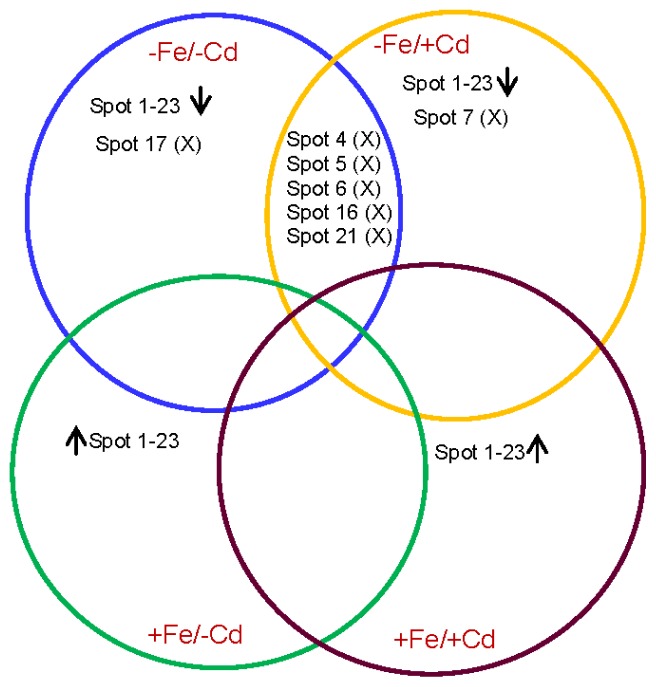
Figure 4.
Venn diagram showing differential expression of root proteins of green gram under four combined Fe and Cd treatemnet. Numbers correspond to the protein spots present in 2DE patterns of +Fe/+Cd, −Fe/−Cd, −Fe/−Cd and +Fe/+Cd. The overlapped portions with “X” denote commonly absent proteins. Upward and downword arrows denote increased or decreased protein expression under four treatments.

