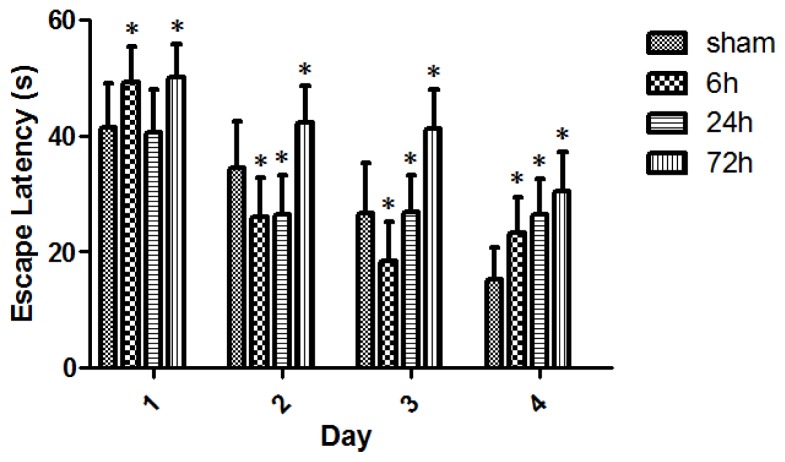
Figure 5.
Escape latency (cm/s) for sham- and TBI-rats in daily MWM test. All sham- and TBI-subgroups had gradually-decreased escape latencies over the consecutive 4 days MWM test, indicating a learning curve. Day1: The escape latency was 41.50 ± 7.55, 49.20 ± 6.13, 40.62 ± 7.52, and 49.81 ± 6.63, respectively, for the group of sham, 6, 24, and 72 h. Day2: The escape latency was 34.44 ± 8.14, 25.75 ± 6.93, 26.29 ± 6.69, and 42.25 ± 6.26, respectively, for these above groups. Day3: The escape latency was 26.72 ± 8.59, 18.45 ± 6.31, 26.89 ± 6.30, and 41.24 ± 6.73, respectively, for these groups. Day4: The escape latency was 15.32 ± 5.36, 23.20 ± 6.11, 26.53 ± 5.92, and 30.36 ± 6.83, respectively, for these groups. With each MWM test day, 72 h survived-rats demonstrated a significant increase in escape latency. However, TBI-rats did not have an expected and stable delay in escape latency across 6 and 24 h survival on the 1st, 2nd, and 3rd day’s MWM tests. On the 4th day of MWM test, an apparent gradual delay in escape latency across 6, 24, and 72 h was observed in TBI-rats. Data are presented as mean ± SEM, n = 8. * p < 0.05, compared with sham-rats.

