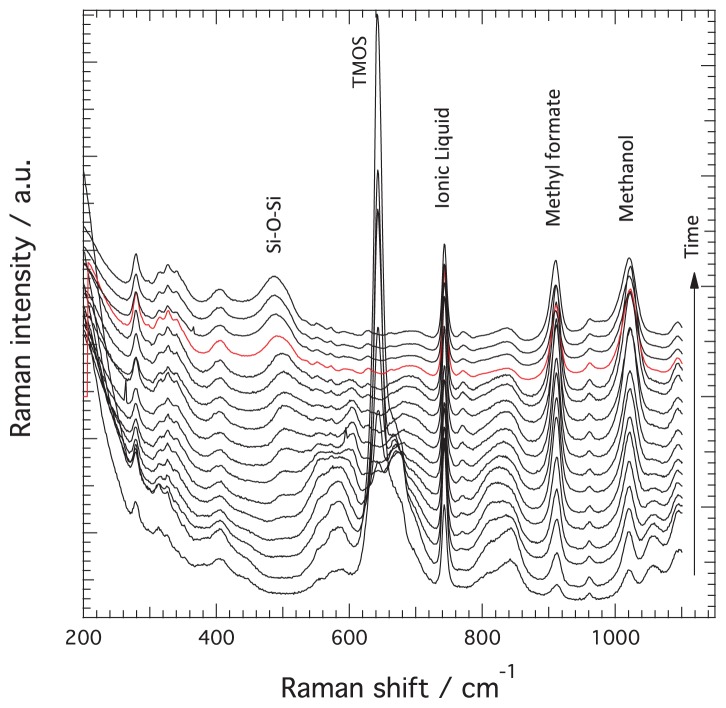
Figure 1.
A selection of Raman spectra collected during the sol-gel reaction in the presence of the protic ionic liquid C2HImTFSI. Spectra recorded at increasing times (indicated by the vertical arrow) are shown from bottom to top with a vertical offset. The spectrum collected at the time of gelation is highlighted in red. Characteristic Raman frequencies associated to silica, TMOS, ionic liquid, methyl formate, and methanol are also indicated.

