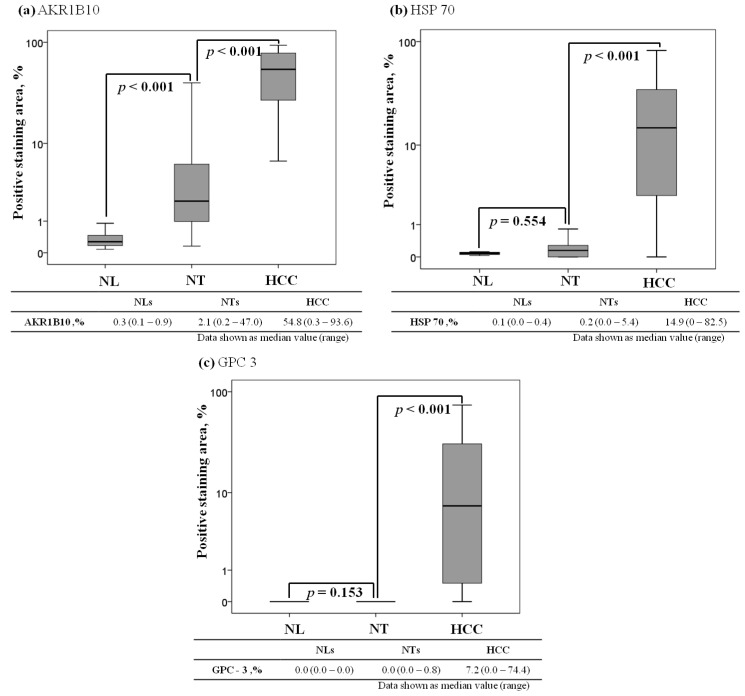
Figure 2.
Comparison of AKR1B10, HSP70, and GPC3 expression levels among control normal liver tissues (NLs), non-tumorous liver tissues (NTs), and hepatocellular carcinomas (HCCs). The box encompasses the 25th through 75th percentiles, and the horizontal line through the middle of the box indicates the fiftieth percentile (median). The 10th and 90th percentiles are shown as whisker caps. (a) AKR1B10 expression; (b) HSP70 expression; and (c) GPC3 expression.

