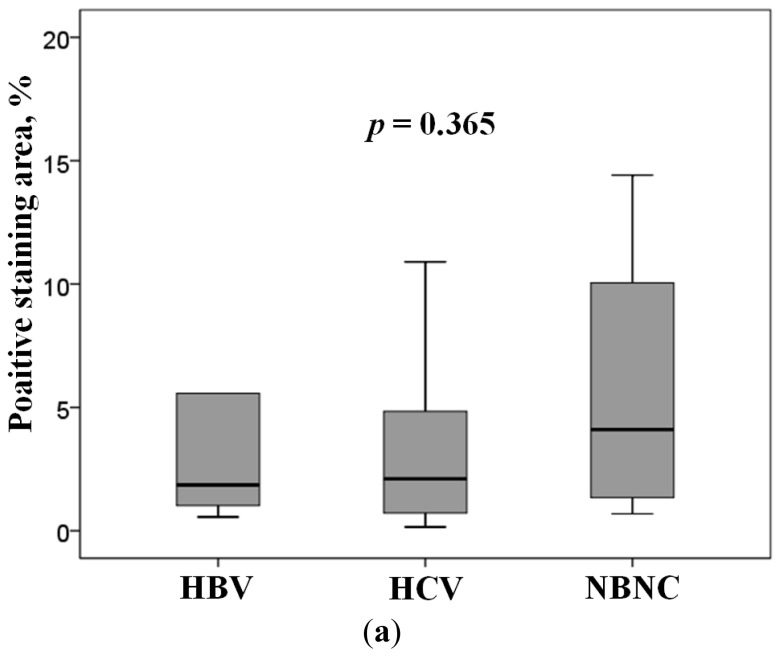
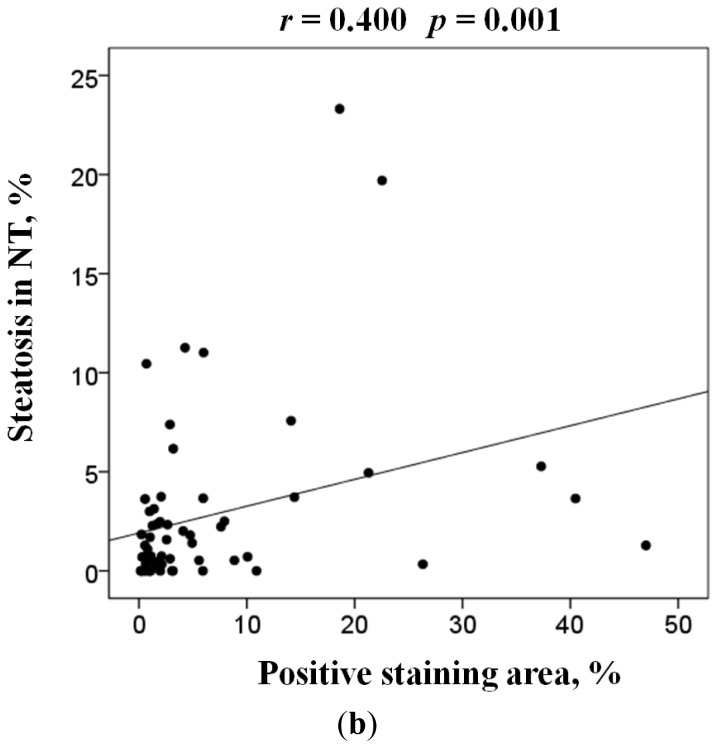
Figure 3.
(a) ARK1B10 expression level in non-tumorous liver tissue. HBV, positive for HBsAg; HCV, positive for anti-HCV; NBNC, negative for HBsAg and anti-HCV. The box encompasses the twenty-fifth through seventy-fifth percentiles, and the horizontal line through the middle of the box indicates the fiftieth percentile (median). The tenth and ninetieth percentiles are shown as whisker caps; and (b) Regression analysis of the relationship between AKR1B10 expression and hepatic steatosis in non-tumorous liver tissues.


