Figure 1.
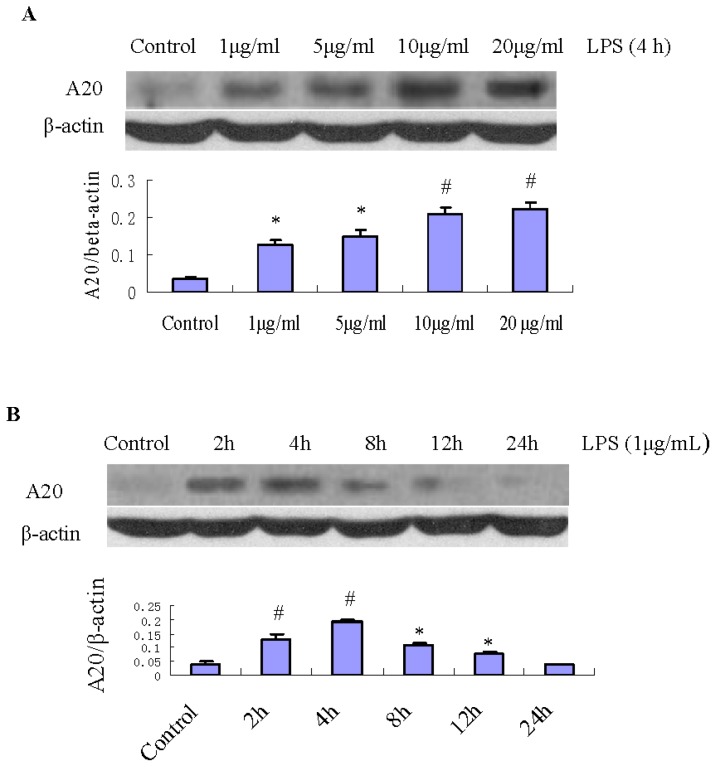
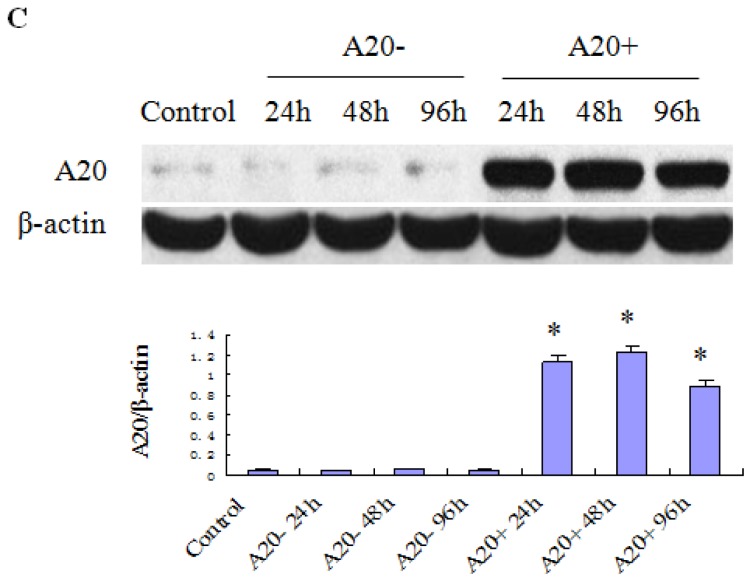
Changes in the protein expression of A20 in RPMCs after exposure to LPS. (A) RPMCs were treated with 1, 5, 10, and 20 μg/mL LPS for 4 h, respectively. Untreated cells were used as the control. The relative expression of A20 protein was determined by normalization to β-actin. Western blots are representative of three separate experiments. Bar graph shows the relative expression of A20. Data are presented as the mean ± SD (n = 3). * p <0.01 and # p < 0.005 vs. control; (B) Changes in the protein expression of A20 in RPMCs after exposure to LPS. RPMCs were treated with 1 μg/mL LPS for various times (2, 4, 8, 12, and 24 h). Untreated cells were used as the control. The relative expression of A20 protein was determined by normalization to β-actin. Western blots are representative of three independent experiments. Bar graph shows the relative protein expression of A20. Data are presented as the mean ± SD (n = 3). * p < 0.05 and # p < 0.01 vs. control; (C) The protein expression of A20 in RPMCs in the absence (A20−) or presence (A20+) of pGEM-T easy-A20 (1 μg/well). RPMCs were transfected with pGEM-T easy or pGEM-T easy-A20 for 24, 48, and 96 h, respectively. Cells incubated with serum-free DMEM/F12 alone were used as the control. The relative expression of A20 protein was determined by normalization to β-actin. Western blots are representative of three separate experiments. Bar graph shows the relative protein expression of A20. Data are presented as the mean ± SD (n = 3). * p < 0.001 vs. control.


