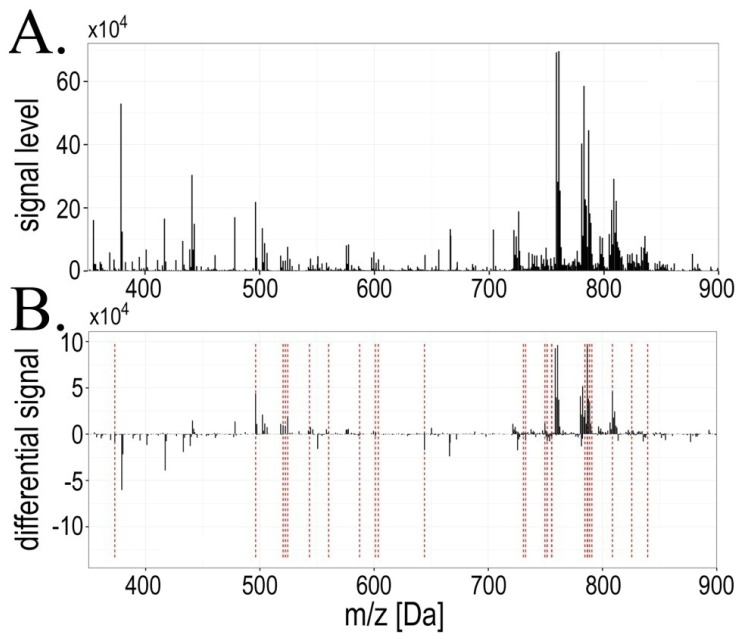
Figure 1.
Mass profiles of serum lipids were affected during radiotherapy. (Panel A): Averaged mass spectrum of serum lipids registered in the 350–900 Da range for pre-treatment samples (A); (Panel B): Averaged differential spectrum for pre-treatment and within-treatment samples (AΔB); components that changed their abundances significantly (FDR < 5%) are marked with red lines.

