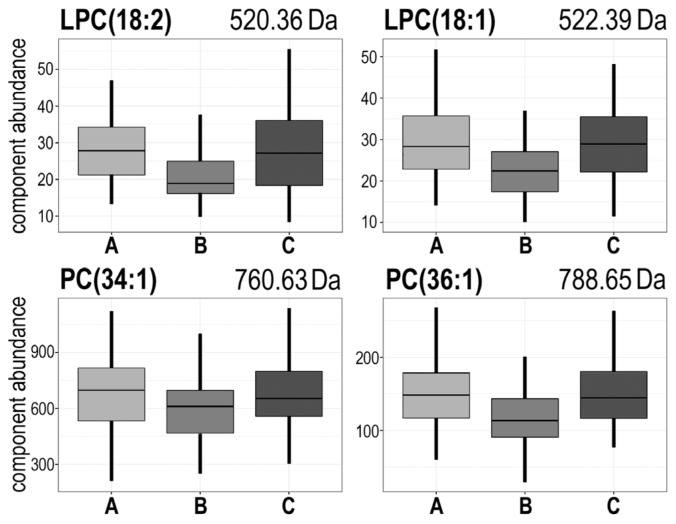
Figure 3.
The abundance of several choline-containing phospholipids decreased markedly during radiotherapy and increased afterward. Presented are examples of lysophosphatidylcholines: LPC(18:2) [m/z = 520.36 Da] and LPC(18:1) [m/z = 522.39 Da], and phosphatidylcholines: PC(34:1) [m/z = 760.63 Da] and PC(36:1) [m/z = 788.65 Da]. Boxplots show: minimum, lower quartile, median, upper quartile and maximum values (outliers were removed from the plots for perspicuity).

