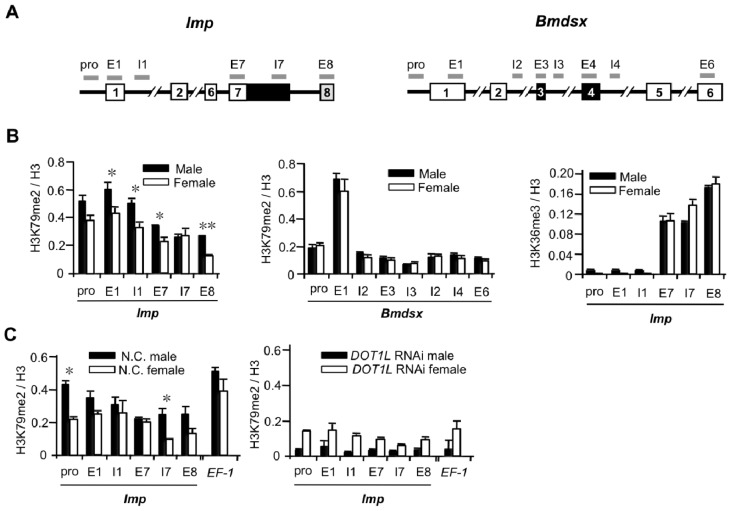
Figure 3.
Increased H3K79 methylation across Imp in males. (A) Schematic representation of Imp and Bmdsx genes showing the distribution of quantitative (q) PCR amplicons used in the analysis; (B) Mapping of H3K79me2 across Imp (left panel) and Bmdsx (middle panel) and of H3K36me3 across Imp (right panel) in female (black) and male (white) larval tissues by chromatin immunoprecipitation (ChIP)-qPCR. Values represent the means ± SE of six qPCR values from one representative of five independent experiments. * p < 0.05, ** p < 0.01, Student’s t-test; (C) ChIP assays with antibodies to H3K79me2 and H3 and chromatin prepared from 60-pooled negative control embryos of each sex (left panel) or 60-pooled DOT1L siRNA-injected embryos of each sex (right panel). The relative enrichment of H3K79me2 on EF-2 exon2 or along Imp was quantified by qPCR using primer sets indicated in A and expressed as a fraction of histone H3. Values represent the means ± SE of two independent qPCR assays from one representative of two independent experiments. * p < 0.05, Student’s t-test. The percentage of input was normalized to unmodified H3.

