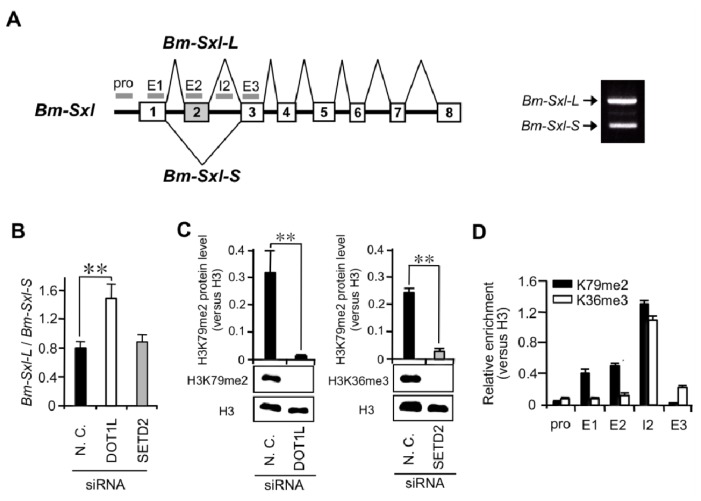
Figure 4.
Effect of DOT1L knockdown on alternative splicing of Bm-Sxl and distribution of H3K79me2 around the alternatively spliced exon in Bm-Sxl. (A) Schematic representation of Bm-Sxl showing the distribution of qPCR amplicons used in the analysis; (B) The ratio of Bm-Sxl-L to Bm-Sxl-S was analyzed by qRT-PCR. SD; n = 5 individuals. ** p < 0.01, Student’s t-test; (C) Western blotting analysis of H3K79me2 protein extracted from negative control or DOT1L siRNA-injected embryos using anti-H3K79me2 and anti-H3 antibodies (lower left panel). Quantification of H3K79me2 protein levels, as detected by Western blotting analysis (upper left panel). The intensity of each band was measured using Bioimage Analyser LAS1000. H3K79me2 protein level was normalized to the H3 protein level. Values represent the means ± SE of six bands from one representative of two independent experiments. ** p < 0.01, Student’s t-test. The same analysis was performed on H3K36me3 protein extracted from negative control or SETD2 siRNA-injected embryos using anti-H3K79me2 and anti-H3 antibodies (upper and lower right panels); (D) Mapping of H3K79me2 (black) and H3K36me3 (white) around Bm-Sxl exon 2 in larval tissues by ChIP-qPCR. Values represent the means ± SE of six qPCR values from one representative of five independent experiments.

