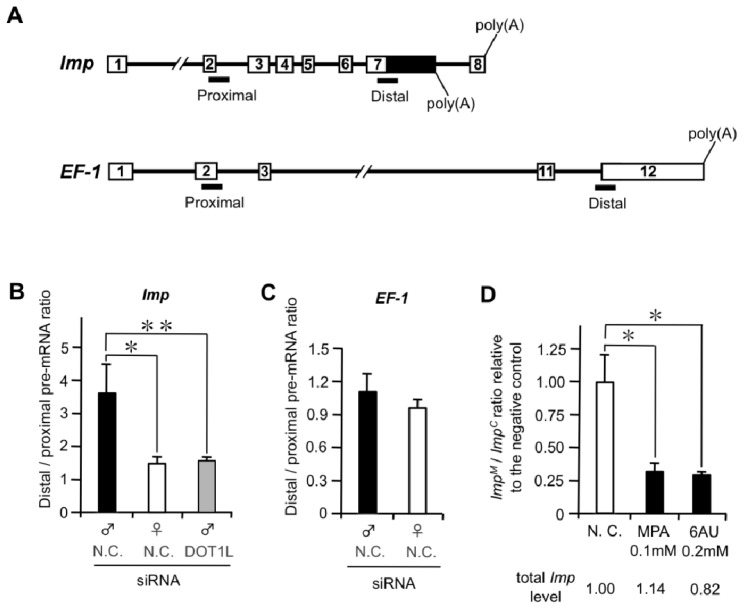
Figure 5.
Male and female differences in RNAP II processivity in Imp. (A) Schematic diagram of Imp and EF-1 showing the distribution of the proximal and distal amplicons (black bars) used for qPCR analysis; (B,C) RNAP II processivity was determined as a ratio of the proximal and distal pre-mRNA sequences (distal/proximal) of Imp (B) and EF-1 (C). The abundance of each pre-mRNA was determined by quantitative (q)PCR. Values represent the means ± SE of six qPCR values from three individuals; (D) Inhibitors of nucleotide biosynthesis suppress male-specific splicing of Imp pre-mRNA. qRT-PCR analysis was performed to calculate the ratio of ImpM to ImpC. The ImpM/ImpC ratio in male cells treated with 0.1 mM mycophenolic acid (MPA) or with 0.2 mM 6-azauracil (6AU) (C) is relative to that in the negative control cells in each experiment. Values represent the means ± SE from three individual experiments. * p < 0.05, ** p < 0.01, Student’s t-test. Values below each graph indicate total Imp mRNA expression in the cells examined relative to those in the negative control cells.

