
Figure 3.

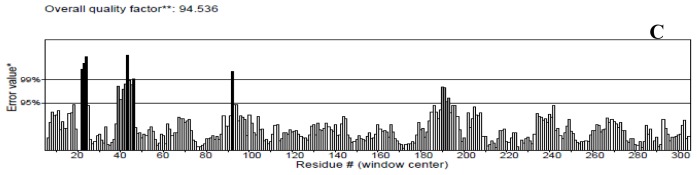
ERRAT plots for (A) NBD; (B) K71L and (C) T204V mutants. Black bars identify the misfolded region located distantly from the active site, gray bars demonstrate the error region between 95% and 99%, and white bars indicate the region with a lower error rate for protein folding. * On the error axis, two lines are drawn to indicate the confidence with which it is possible to reject regions that exceed that error value. ** Expressed as the percentage of the protein for which the calculated error value falls below the 95% rejection limit. Good high resolution structures generally produce values around 95% or higher. For lower resolutions (2.5 to 3 A) the average overall quality factor is around 91%.