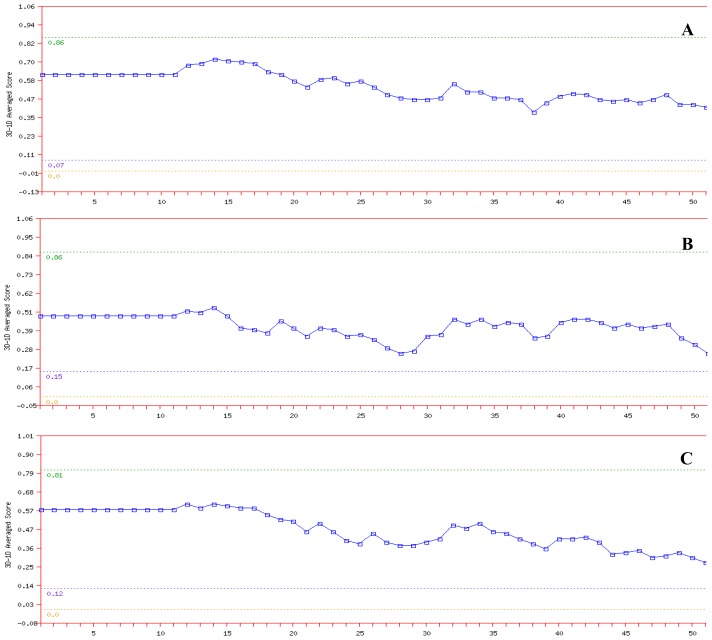
Figure 4.
Verify 3D plots for (A) NBD protein; (B) K71L and (C) T204V mutants. Each residue was assigned a structural class based on its location and environment (alpha, beta, loop, polar, nonpolar, etc.). A collection of good structures was used as a reference to obtain a score for each of the 20 amino acids in this structural class. The scores of a sliding 21-residue window (from −10 to +10) were added and plotted for individual residues.

