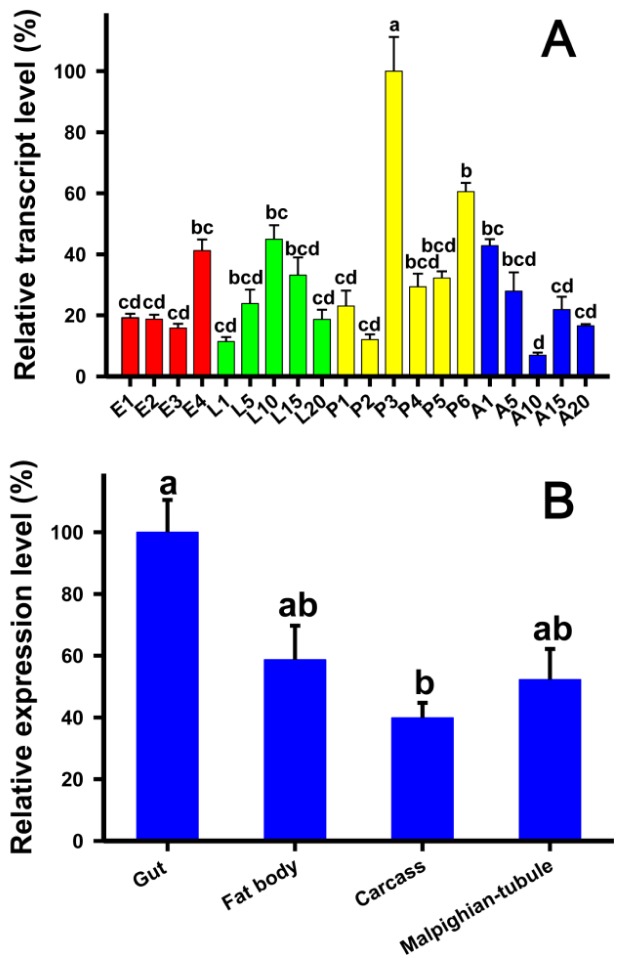
Figure 4.
Relative transcript levels of TcLgl at different developmental stages (A) and in different tissues of 3-day pupae (B) of T. castaneum as determined by RT-qPCR. E1, E2, E3, and E4 represent 1-, 2-, 3-, and 4-day eggs; L1, L5, L10, L15, and L20 represent 1-, 5-, 10-, 15-, and 20-day larvae; P1, P2, P3, P4, P5, and P6 represent 1-, 2-, 3-, 4-, 5-, and 6-day pupae; and A1, A5, A10, A15, and A20 represent 1-, 5-, 10-, 15-, and 20-day adults, respectively. The carcass represents the remaining body after the brain, ganglia, gut, and fat bodies were removed. For developmental stage/day expression profiling, each sample consisted of 60 eggs, 5 larvae, 5 pupae, or 5 adults. For tissue expression profiling in 3-day pupae, each sample of the guts, fat bodies and carcass was prepared from 30 pupae, and each sample of Malpighian tubules was prepared from 60 pupae. Each developmental stage/day or tissue type was analyzed with three biological samples and each sample was run with two technical replicates. Different letters above the standard error bars indicate significant differences based on ANOVA followed by Tukey’s honestly significant difference (HSD) multiple comparison test (p < 0.05). T. castaneum ribosomal protein S3 (TcRps3) was used as an internal reference gene to normalize the differences among the samples. Relative expression levels for TcLgl were calculated based on the highest expressions of TcLgl in 3-day pupae (P3) and in the gut as 100% in the developmental stage and the tissue-dependent expression analyses, respectively.

