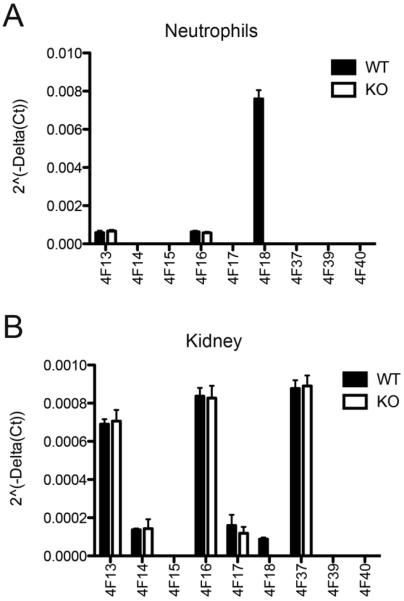
Fig. 8.
Expression of CYP4F family members.
Reverse transcription and real time PCR was used to measure CYP4F expression in bone marrow neutrophils (A), and normal kidney tissue (B). ΔCt values were determined for each CYP4F using GAPDH as endogenous control, and 2−ΔCt values were plotted for wild type (WT) and Cyp4f18−/− (KO) samples (n = 4). Relative quantitation (2−ΔΔCt) determined that there was no significant change in expression of any CYP4F in knockout samples compared to wild-type, except for the loss of CYP4F18.

